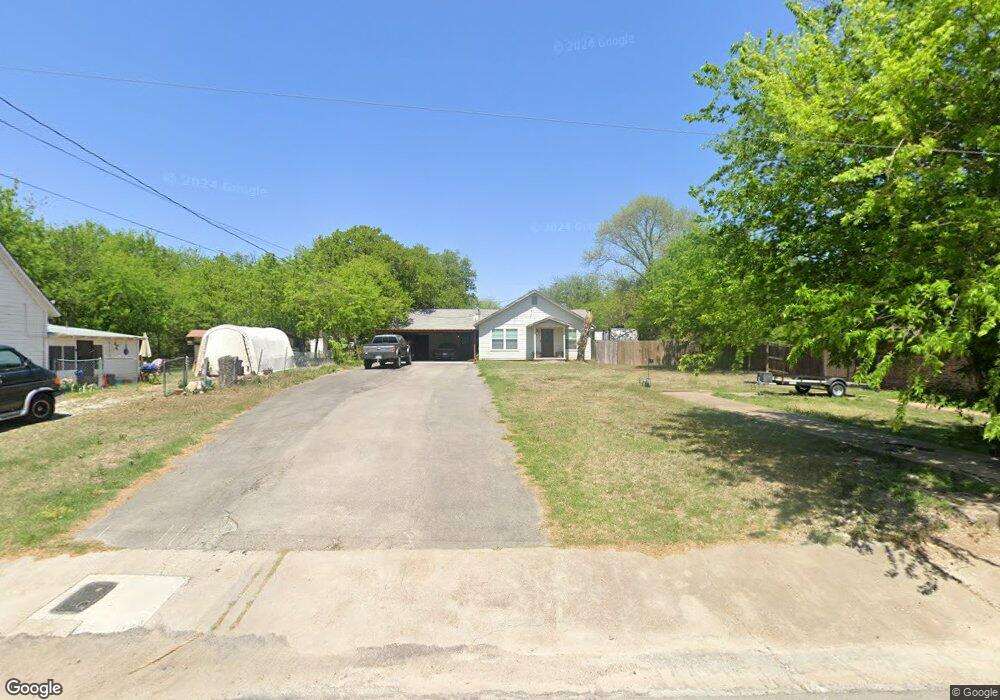
315 Throckmorton St Weatherford, TX 76086
Estimated Value: $247,070 - $303,000
--
Bed
--
Bath
1,508
Sq Ft
$176/Sq Ft
Est. Value
About This Home
This home is located at 315 Throckmorton St, Weatherford, TX 76086 and is currently estimated at $264,768, approximately $175 per square foot. 315 Throckmorton St is a home located in Parker County with nearby schools including Seguin Elementary School, Tison Middle School, and Weatherford High School.
Ownership History
Date
Name
Owned For
Owner Type
Purchase Details
Closed on
Oct 16, 2014
Sold by
Hetling Donald J
Bought by
Hetling Jason Allen and Hetling Candice Jean
Current Estimated Value
Purchase Details
Closed on
Dec 6, 2004
Sold by
Smith Edward N
Bought by
Hetling Jason Allen and Candice Jean
Create a Home Valuation Report for This Property
The Home Valuation Report is an in-depth analysis detailing your home's value as well as a comparison with similar homes in the area
Home Values in the Area
Average Home Value in this Area
Purchase History
| Date | Buyer | Sale Price | Title Company |
|---|---|---|---|
| Hetling Jason Allen | -- | None Available | |
| Hetling Jason Allen | -- | -- |
Source: Public Records
Tax History Compared to Growth
Tax History
| Year | Tax Paid | Tax Assessment Tax Assessment Total Assessment is a certain percentage of the fair market value that is determined by local assessors to be the total taxable value of land and additions on the property. | Land | Improvement |
|---|---|---|---|---|
| 2025 | $2,356 | $193,564 | -- | -- |
| 2024 | $2,356 | $175,967 | -- | -- |
| 2023 | $2,356 | $159,970 | $0 | $0 |
| 2022 | $3,226 | $148,970 | $15,000 | $133,970 |
| 2021 | $3,175 | $148,970 | $15,000 | $133,970 |
| 2020 | $2,904 | $133,580 | $15,000 | $118,580 |
| 2019 | $2,210 | $112,280 | $15,000 | $97,280 |
| 2018 | $2,018 | $78,670 | $15,000 | $63,670 |
| 2017 | $2,063 | $78,416 | $15,000 | $63,416 |
| 2016 | $2,255 | $85,720 | $15,000 | $70,720 |
| 2015 | $2,209 | $85,720 | $15,000 | $70,720 |
| 2014 | $1,957 | $77,930 | $15,000 | $62,930 |
Source: Public Records
Map
Nearby Homes
- 319 Throckmorton St
- 321 Throckmorton St
- 311 Throckmorton St
- 709 N Rusk St
- 314 Edna St
- 312 Edna St
- 310 Edna St
- 611 N Rusk St Unit 613
- 611 N Rusk St Unit 613
- 611 N Rusk St
- 401 Throckmorton St
- 713 N Rusk St
- 305 Throckmorton St
- 613 N Rusk St
- 308 Edna St
- tbd Throckmorton St
- 708 N Rusk St
- 708 N Walnut St
- 710 N Rusk St
- 403 Throckmorton St