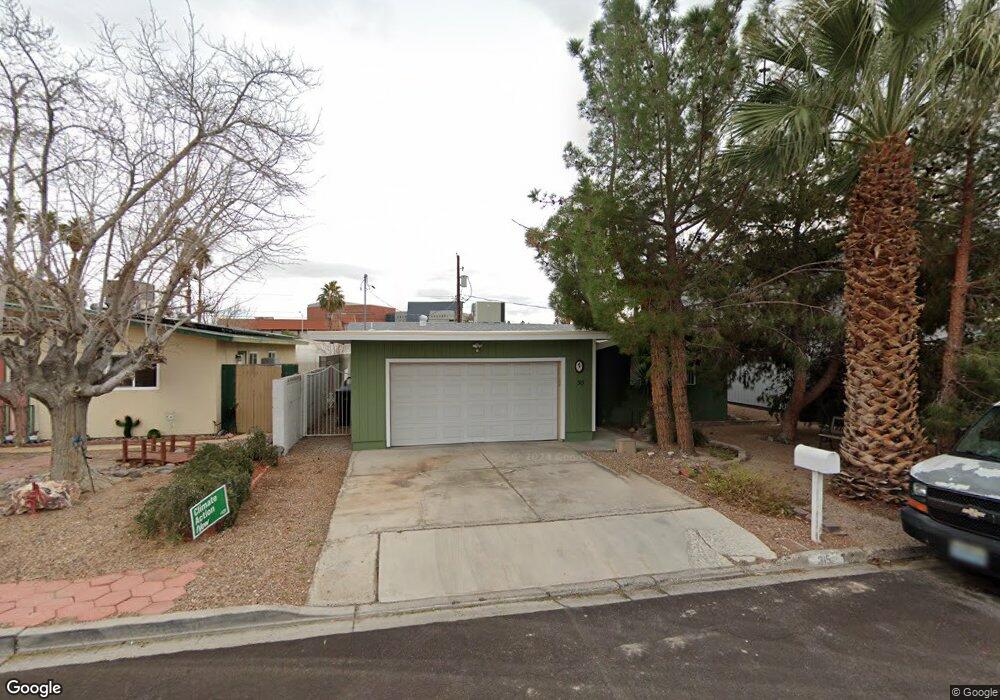
315 Vandalia St Las Vegas, NV 89106
Rancho Oakey NeighborhoodEstimated Value: $332,000 - $460,000
3
Beds
2
Baths
1,523
Sq Ft
$251/Sq Ft
Est. Value
About This Home
This home is located at 315 Vandalia St, Las Vegas, NV 89106 and is currently estimated at $382,729, approximately $251 per square foot. 315 Vandalia St is a home located in Clark County with nearby schools including Howard Wasden Elementary School, Hyde Park Middle School, and Ed W Clark High School.
Ownership History
Date
Name
Owned For
Owner Type
Purchase Details
Closed on
Aug 19, 2022
Sold by
Sheila Saint
Bought by
Sheila Marie Saint Trust
Current Estimated Value
Purchase Details
Closed on
Dec 29, 2004
Sold by
Saint Sheila
Bought by
Saint Sheila and Render Sur
Purchase Details
Closed on
Aug 19, 2002
Sold by
Hud
Bought by
Saint Sheila
Home Financials for this Owner
Home Financials are based on the most recent Mortgage that was taken out on this home.
Original Mortgage
$50,800
Interest Rate
6.52%
Purchase Details
Closed on
Jun 17, 2002
Sold by
Saint Om H
Bought by
Saint Sheila
Purchase Details
Closed on
Feb 25, 2002
Sold by
Countrywide Home Loans
Bought by
Hud
Purchase Details
Closed on
Jul 9, 1997
Sold by
Albrecht Michael G and Albrecht Keyser
Bought by
Glass Lewis D and Glass Joanna Marie
Home Financials for this Owner
Home Financials are based on the most recent Mortgage that was taken out on this home.
Original Mortgage
$99,029
Interest Rate
7.58%
Mortgage Type
FHA
Create a Home Valuation Report for This Property
The Home Valuation Report is an in-depth analysis detailing your home's value as well as a comparison with similar homes in the area
Home Values in the Area
Average Home Value in this Area
Purchase History
| Date | Buyer | Sale Price | Title Company |
|---|---|---|---|
| Sheila Marie Saint Trust | -- | John Park Law | |
| Saint Sheila | -- | -- | |
| Saint Sheila | $107,000 | First American Title Co | |
| Saint Sheila | -- | First American Title Co | |
| Hud | $112,095 | Stewart Title | |
| Countrywide Home Loans Inc | $112,095 | Stewart Title | |
| Glass Lewis D | $100,000 | Old Republic Title Company |
Source: Public Records
Mortgage History
| Date | Status | Borrower | Loan Amount |
|---|---|---|---|
| Previous Owner | Saint Sheila | $50,800 | |
| Previous Owner | Glass Lewis D | $99,029 |
Source: Public Records
Tax History Compared to Growth
Tax History
| Year | Tax Paid | Tax Assessment Tax Assessment Total Assessment is a certain percentage of the fair market value that is determined by local assessors to be the total taxable value of land and additions on the property. | Land | Improvement |
|---|---|---|---|---|
| 2025 | $716 | $57,437 | $33,600 | $23,837 |
| 2024 | $695 | $57,437 | $33,600 | $23,837 |
| 2023 | $695 | $48,047 | $24,150 | $23,897 |
| 2022 | $675 | $45,168 | $22,750 | $22,418 |
| 2021 | $656 | $39,708 | $17,850 | $21,858 |
| 2020 | $634 | $38,304 | $16,100 | $22,204 |
| 2019 | $615 | $35,904 | $13,650 | $22,254 |
| 2018 | $597 | $34,363 | $12,600 | $21,763 |
| 2017 | $1,101 | $33,585 | $11,200 | $22,385 |
| 2016 | $567 | $32,738 | $9,100 | $23,638 |
| 2015 | $565 | $31,764 | $8,050 | $23,714 |
| 2014 | $548 | $23,269 | $2,800 | $20,469 |
Source: Public Records
Map
Nearby Homes
- 360 Vandalia St
- 321 Beaumont St
- 248 Crystal Rose Ct
- 2016 Pinto Ln
- 2005 Pinto Ln
- 312 Park Way W
- 1908 W Mesquite Ave
- 1921 Granite Ave
- 226 Dalmatian Ln
- 2401 Driftwood Dr
- 2323 Pinto Ln
- 330 Rancho Cir
- 27 Onyx Way
- 19 Zircon Cir
- 2504 Windjammer Way
- 2505 Rancho Bel Air Dr
- 0 Iron Horse Ct
- 2500 Wimbledon Dr
- 814 W Bonanza Rd
- 1202 S Rancho Dr
- 317 Vandalia St
- 311 Vandalia St
- 319 Vandalia St
- 309 Vandalia St
- 348 Deauville St
- 318 Deauville St
- 307 Vandalia St
- 325 Vandalia St
- 350 Deauville St
- 312 Deauville St
- 312 Vandalia St
- 310 Vandalia St
- 320 Vandalia St
- 354 Deauville St
- 308 Deauville St
- 305 Vandalia St
- 306 Vandalia St
- 326 Vandalia St
- 361 Vandalia St
- 358 Deauville St