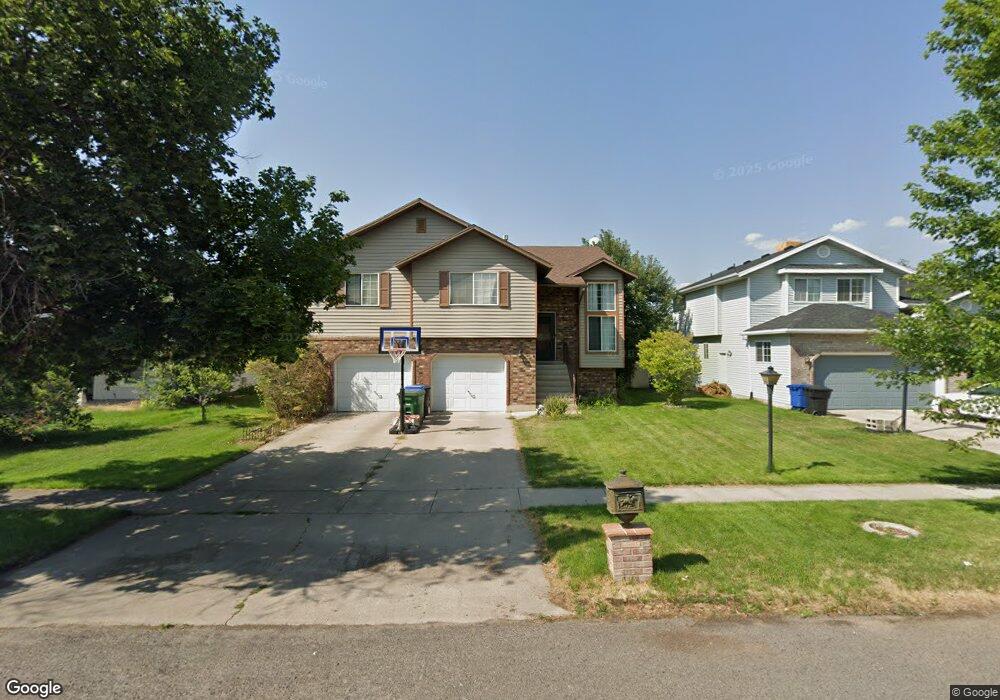
315 W 1330 N Logan, UT 84341
Bridger NeighborhoodEstimated Value: $410,000 - $508,000
5
Beds
3
Baths
2,281
Sq Ft
$197/Sq Ft
Est. Value
About This Home
This home is located at 315 W 1330 N, Logan, UT 84341 and is currently estimated at $450,085, approximately $197 per square foot. 315 W 1330 N is a home located in Cache County with nearby schools including Bridger School, Mount Logan Middle School, and Logan High School.
Ownership History
Date
Name
Owned For
Owner Type
Purchase Details
Closed on
Sep 20, 2014
Sold by
Frisby Bradley S and Frisby Stephanie A
Bought by
Pratt John A and Pratt Sarah Lb
Current Estimated Value
Home Financials for this Owner
Home Financials are based on the most recent Mortgage that was taken out on this home.
Original Mortgage
$6,500
Outstanding Balance
$4,949
Interest Rate
4.07%
Mortgage Type
Unknown
Estimated Equity
$445,136
Purchase Details
Closed on
May 17, 2006
Sold by
Chiang Chi
Bought by
Wiser Boyd C and Wiser Natalie S
Home Financials for this Owner
Home Financials are based on the most recent Mortgage that was taken out on this home.
Original Mortgage
$168,358
Interest Rate
6.41%
Mortgage Type
FHA
Purchase Details
Closed on
Jul 30, 2002
Sold by
Hsu Andy and Hsu Sheu Nan
Bought by
Chiang Chi
Home Financials for this Owner
Home Financials are based on the most recent Mortgage that was taken out on this home.
Original Mortgage
$106,400
Interest Rate
6.6%
Create a Home Valuation Report for This Property
The Home Valuation Report is an in-depth analysis detailing your home's value as well as a comparison with similar homes in the area
Home Values in the Area
Average Home Value in this Area
Purchase History
| Date | Buyer | Sale Price | Title Company |
|---|---|---|---|
| Pratt John A | -- | Advanced Title | |
| Wiser Boyd C | -- | Advanced Title | |
| Wiser Boyd C | -- | Advanced Title | |
| Chiang Chi | -- | Hickman Land Title Company | |
| Chiang Chi | -- | Hickman Land Title Company |
Source: Public Records
Mortgage History
| Date | Status | Borrower | Loan Amount |
|---|---|---|---|
| Open | Pratt John A | $6,500 | |
| Open | Pratt John A | $156,750 | |
| Previous Owner | Wiser Boyd C | $168,358 | |
| Previous Owner | Chiang Chi | $106,400 |
Source: Public Records
Tax History Compared to Growth
Tax History
| Year | Tax Paid | Tax Assessment Tax Assessment Total Assessment is a certain percentage of the fair market value that is determined by local assessors to be the total taxable value of land and additions on the property. | Land | Improvement |
|---|---|---|---|---|
| 2025 | $1,813 | $234,525 | $0 | $0 |
| 2024 | $1,872 | $234,525 | $0 | $0 |
| 2023 | $1,954 | $233,315 | $0 | $0 |
| 2022 | $1,772 | $197,570 | $0 | $0 |
| 2021 | $1,721 | $296,370 | $45,000 | $251,370 |
| 2020 | $1,551 | $240,443 | $45,000 | $195,443 |
| 2019 | $1,621 | $240,442 | $45,000 | $195,442 |
| 2018 | $1,587 | $214,950 | $45,000 | $169,950 |
| 2017 | $1,494 | $106,975 | $0 | $0 |
| 2016 | $1,549 | $91,080 | $0 | $0 |
| 2015 | $1,320 | $91,045 | $0 | $0 |
| 2014 | $1,193 | $91,045 | $0 | $0 |
| 2013 | -- | $91,045 | $0 | $0 |
Source: Public Records
Map
Nearby Homes
- 2200 N 220 W
- 1515 N 450 W Unit 103
- 514 W 1490 N Unit 102
- 559 W 1350 N Unit 41
- 539 W 1465 N Unit 17-102
- 446 W 1595 N Unit 103
- 1492 N 565 W Unit 101
- 1584 N 565 W Unit 104
- 1565 N 565 W Unit 101
- 2 Somerset Place
- 1762 N 460 W Unit 103-10
- 1030 N 130 W Unit 100
- 60 Hampton Place
- 85 Hampton Place
- 259 W 1800 N
- 1926 Lavender Loop Unit 6
- 897 N 250 W
- 894 N 400 W
- 873 N 480 W
- 430 W 810 N