Estimated Value: $120,000 - $148,000
3
Beds
1
Bath
1,032
Sq Ft
$127/Sq Ft
Est. Value
About This Home
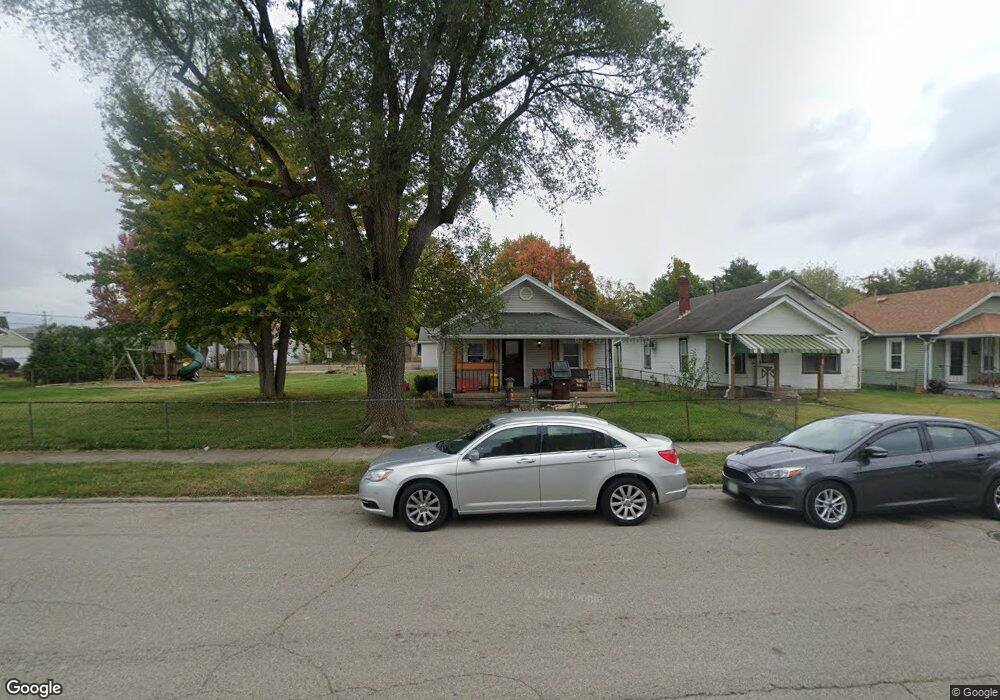
This home is located at 315 Walnut St, Xenia, OH 45385 and is currently estimated at $130,860, approximately $126 per square foot. 315 Walnut St is a home located in Greene County with nearby schools including Xenia High School, Summit Academy Community School for Alternative Learners - Xenia, and Legacy Christian Academy.
Ownership History
Date
Name
Owned For
Owner Type
Purchase Details
Closed on
Jun 21, 2024
Sold by
Langan James T and Langan Heather M
Bought by
Langan James Andrew
Current Estimated Value
Purchase Details
Closed on
Aug 17, 2023
Sold by
Langan James T
Bought by
Langan James T and Langan Heather
Purchase Details
Closed on
Dec 3, 1996
Sold by
Johnson Robert J
Bought by
Langan James T
Home Financials for this Owner
Home Financials are based on the most recent Mortgage that was taken out on this home.
Original Mortgage
$67,341
Interest Rate
7.94%
Mortgage Type
FHA
Create a Home Valuation Report for This Property
The Home Valuation Report is an in-depth analysis detailing your home's value as well as a comparison with similar homes in the area
Home Values in the Area
Average Home Value in this Area
Purchase History
| Date | Buyer | Sale Price | Title Company |
|---|---|---|---|
| Langan James Andrew | $115,000 | None Listed On Document | |
| Langan James T | -- | None Listed On Document | |
| Langan James T | $67,900 | -- |
Source: Public Records
Mortgage History
| Date | Status | Borrower | Loan Amount |
|---|---|---|---|
| Previous Owner | Langan James T | $67,341 |
Source: Public Records
Tax History Compared to Growth
Tax History
| Year | Tax Paid | Tax Assessment Tax Assessment Total Assessment is a certain percentage of the fair market value that is determined by local assessors to be the total taxable value of land and additions on the property. | Land | Improvement |
|---|---|---|---|---|
| 2024 | $1,306 | $30,520 | $4,690 | $25,830 |
| 2023 | $1,306 | $30,520 | $4,690 | $25,830 |
| 2022 | $1,172 | $23,360 | $3,760 | $19,600 |
| 2021 | $1,188 | $23,360 | $3,760 | $19,600 |
| 2020 | $1,138 | $23,360 | $3,760 | $19,600 |
| 2019 | $1,123 | $21,700 | $3,760 | $17,940 |
| 2018 | $1,127 | $21,700 | $3,760 | $17,940 |
| 2017 | $1,079 | $21,700 | $3,760 | $17,940 |
| 2016 | $1,079 | $20,390 | $3,760 | $16,630 |
| 2015 | $1,082 | $20,390 | $3,760 | $16,630 |
| 2014 | $1,036 | $20,390 | $3,760 | $16,630 |
Source: Public Records
Map
Nearby Homes