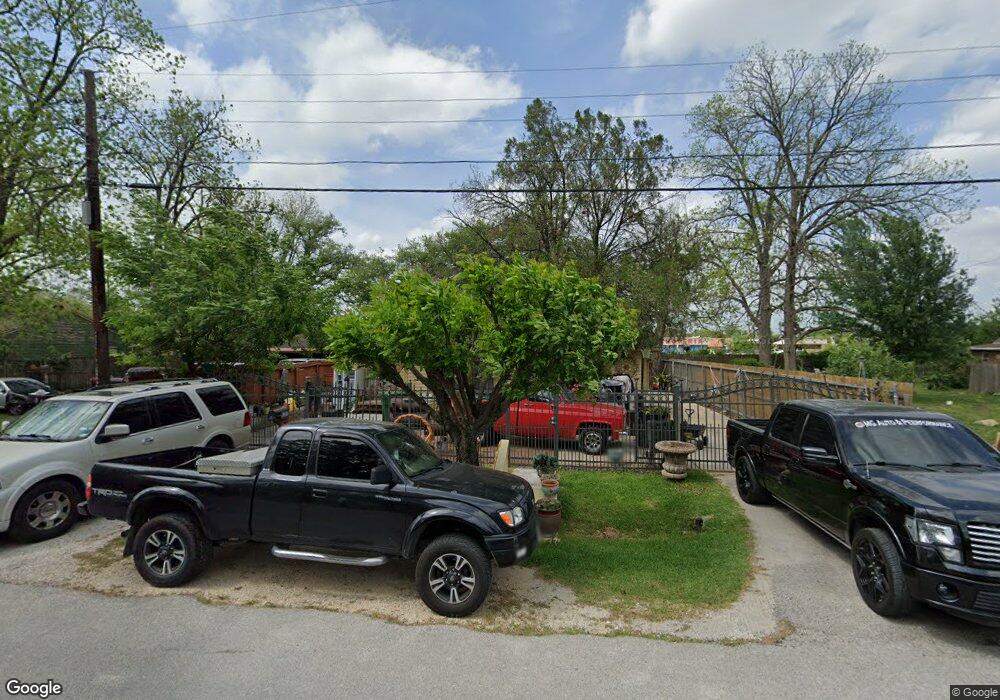
315 Wynell St Houston, TX 77022
Northside-Northline NeighborhoodEstimated Value: $179,427 - $286,000
2
Beds
1
Bath
1,338
Sq Ft
$176/Sq Ft
Est. Value
About This Home
This home is located at 315 Wynell St, Houston, TX 77022 and is currently estimated at $234,857, approximately $175 per square foot. 315 Wynell St is a home located in Harris County with nearby schools including Burbank Elementary School, Burbank Middle School, and Sam Houston Math, Science & Technology Center.
Ownership History
Date
Name
Owned For
Owner Type
Purchase Details
Closed on
Mar 23, 2007
Sold by
Delos Reyes Adolfo and De Los Reyes Susana
Bought by
Hernandez Eric
Current Estimated Value
Home Financials for this Owner
Home Financials are based on the most recent Mortgage that was taken out on this home.
Original Mortgage
$87,400
Interest Rate
6.3%
Mortgage Type
Purchase Money Mortgage
Purchase Details
Closed on
Jun 18, 1999
Sold by
Arellano Juan and Arellano Otilia
Bought by
Delosreyes Adolfo and Delosreyes Susana
Home Financials for this Owner
Home Financials are based on the most recent Mortgage that was taken out on this home.
Original Mortgage
$58,500
Interest Rate
7.02%
Mortgage Type
Seller Take Back
Purchase Details
Closed on
Aug 25, 1993
Sold by
Miller Janelle T and Cooper Janelle T
Bought by
Arellano Juan and Arellano Otilia
Home Financials for this Owner
Home Financials are based on the most recent Mortgage that was taken out on this home.
Original Mortgage
$15,000
Interest Rate
7.23%
Mortgage Type
Seller Take Back
Create a Home Valuation Report for This Property
The Home Valuation Report is an in-depth analysis detailing your home's value as well as a comparison with similar homes in the area
Home Values in the Area
Average Home Value in this Area
Purchase History
| Date | Buyer | Sale Price | Title Company |
|---|---|---|---|
| Hernandez Eric | -- | American Title Co | |
| Delosreyes Adolfo | -- | Regency Title | |
| Arellano Juan | -- | -- |
Source: Public Records
Mortgage History
| Date | Status | Borrower | Loan Amount |
|---|---|---|---|
| Closed | Hernandez Eric | $87,400 | |
| Previous Owner | Delosreyes Adolfo | $58,500 | |
| Previous Owner | Arellano Juan | $15,000 |
Source: Public Records
Tax History Compared to Growth
Tax History
| Year | Tax Paid | Tax Assessment Tax Assessment Total Assessment is a certain percentage of the fair market value that is determined by local assessors to be the total taxable value of land and additions on the property. | Land | Improvement |
|---|---|---|---|---|
| 2025 | $1,585 | $177,977 | $95,836 | $82,141 |
| 2024 | $1,585 | $170,409 | $87,955 | $82,454 |
| 2023 | $1,585 | $183,065 | $53,593 | $129,472 |
| 2022 | $2,663 | $156,718 | $53,593 | $103,125 |
| 2021 | $2,562 | $128,437 | $53,593 | $74,844 |
| 2020 | $2,420 | $119,934 | $53,593 | $66,341 |
| 2019 | $2,299 | $114,433 | $44,135 | $70,298 |
| 2018 | $1,379 | $93,016 | $36,884 | $56,132 |
| 2017 | $1,899 | $93,016 | $36,884 | $56,132 |
| 2016 | $1,726 | $97,793 | $34,678 | $63,115 |
| 2015 | $1,103 | $62,056 | $25,220 | $36,836 |
| 2014 | $1,103 | $62,056 | $25,220 | $36,836 |
Source: Public Records
Map
Nearby Homes
- 318 Charlock St
- 253 De Boll St
- 249 De Boll St
- 202 Burbank St
- 216 Burress St
- 9026 Mcgallion Rd
- 702 Pennington St
- 219 Heaney Dr
- 415 Briarcliff Dr
- 108 Fichter St
- 132 Grothe Ln
- 807 Firnat St
- 90 Burress St Unit B
- 90 Burress St Unit A
- 9905 Dipping Brook St
- 9907 Dipping Brook St
- 9909 Dipping Woods St
- 9916 Dipping Woods St
- 9913 Dipping Woods St
- 9902 Clark Rd Unit D