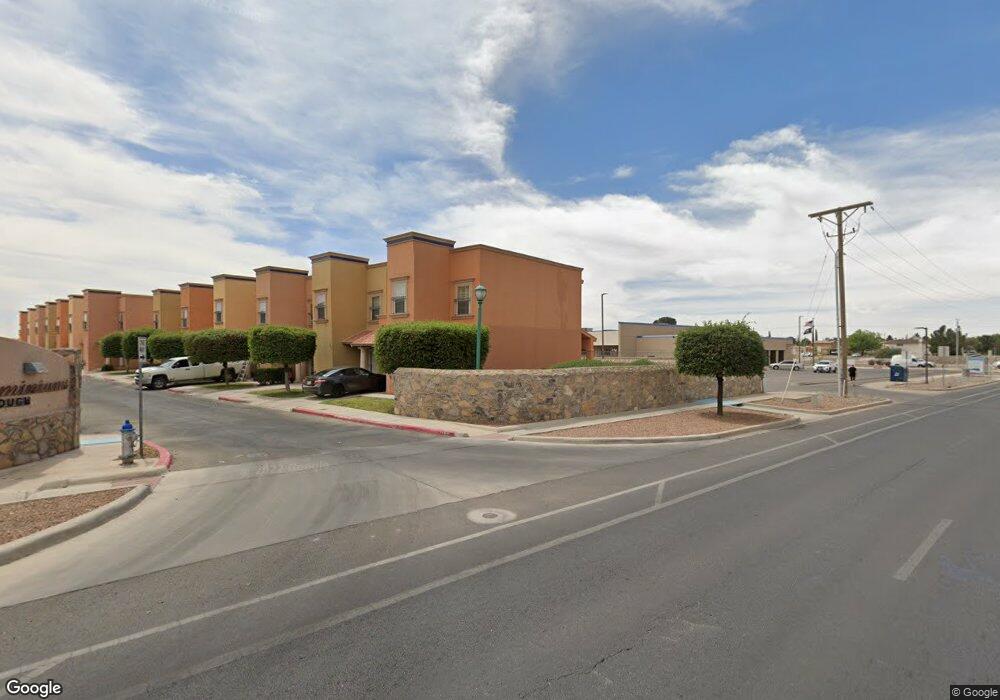
3150 N Yarbrough Dr Unit E El Paso, TX 79925
Pebble Hills NeighborhoodEstimated Value: $157,394 - $194,000
2
Beds
2
Baths
1,217
Sq Ft
$140/Sq Ft
Est. Value
About This Home
This home is located at 3150 N Yarbrough Dr Unit E, El Paso, TX 79925 and is currently estimated at $170,599, approximately $140 per square foot. 3150 N Yarbrough Dr Unit E is a home located in El Paso County with nearby schools including Robbin E L Washington Elementary School, J M Hanks High School, and Jesus Chapel School.
Ownership History
Date
Name
Owned For
Owner Type
Purchase Details
Closed on
Nov 27, 2021
Sold by
Mendoza Christina Carrasco
Bought by
Mendoza Christina
Current Estimated Value
Home Financials for this Owner
Home Financials are based on the most recent Mortgage that was taken out on this home.
Original Mortgage
$82,550
Outstanding Balance
$63,716
Interest Rate
2.35%
Mortgage Type
New Conventional
Estimated Equity
$106,883
Purchase Details
Closed on
Oct 6, 2011
Sold by
Wall Julia
Bought by
Mendoza Christina Carrasco
Home Financials for this Owner
Home Financials are based on the most recent Mortgage that was taken out on this home.
Original Mortgage
$115,983
Interest Rate
4.25%
Mortgage Type
FHA
Purchase Details
Closed on
Jan 28, 2008
Sold by
Ept Pueblo Condominiums Lp
Bought by
Wall Julia
Create a Home Valuation Report for This Property
The Home Valuation Report is an in-depth analysis detailing your home's value as well as a comparison with similar homes in the area
Home Values in the Area
Average Home Value in this Area
Purchase History
| Date | Buyer | Sale Price | Title Company |
|---|---|---|---|
| Mendoza Christina | -- | None Available | |
| Mendoza Christina Carrasco | -- | None Available | |
| Wall Julia | -- | None Available |
Source: Public Records
Mortgage History
| Date | Status | Borrower | Loan Amount |
|---|---|---|---|
| Open | Mendoza Christina | $82,550 | |
| Closed | Mendoza Christina Carrasco | $115,983 |
Source: Public Records
Tax History
| Year | Tax Paid | Tax Assessment Tax Assessment Total Assessment is a certain percentage of the fair market value that is determined by local assessors to be the total taxable value of land and additions on the property. | Land | Improvement |
|---|---|---|---|---|
| 2025 | $1,830 | $137,191 | -- | -- |
| 2024 | $1,830 | $124,719 | -- | -- |
| 2023 | $1,830 | $113,381 | -- | -- |
| 2022 | $3,201 | $103,074 | $11,837 | $91,237 |
| 2021 | $3,218 | $99,000 | $11,837 | $87,163 |
| 2020 | $2,892 | $91,567 | $7,514 | $84,053 |
| 2018 | $2,847 | $91,567 | $7,514 | $84,053 |
| 2017 | $3,666 | $119,942 | $7,514 | $112,428 |
| 2016 | $3,666 | $119,942 | $7,514 | $112,428 |
| 2015 | $3,432 | $119,942 | $7,514 | $112,428 |
| 2014 | $3,432 | $119,942 | $7,514 | $112,428 |
Source: Public Records
Map
Nearby Homes
- 3150 N Yarbrough Dr Unit A1
- 3112 Edgerock Dr
- 3211 Isla Bahia Way
- 3112 Eads Place
- 2912 Chaswood St
- 3251 Isla Morada Dr
- 3008 Eads Place Unit B
- 10304 Blackwood Ave
- 2716 Archie Dr
- 10245 Blackwood Ave
- 2701 Brady Place
- 2705 Fierro Dr
- 10229 Luella Ave
- 3313 Edgerock Dr
- 3300 Tyrone Dr
- 2701 Gaston Dr
- 3332 Dungarvan Dr
- 3318 Limerick Rd
- 10512 Album Ave
- 3320 Tyrone Rd
- 3150 N Yarbrough Dr
- 3150 N Yarbrough Dr Unit E-5
- 3150 N Yarbrough Dr Unit E1
- 3150 N Yarbrough Dr Unit E1
- 3150 N Yarbrough Dr Unit E1
- 3150 N Yarbrough Dr Unit E1
- 3150 N Yarbrough Dr Unit E
- 3150 N Yarbrough Dr Unit E
- 3150 N Yarbrough Dr Unit E
- 3150 N Yarbrough Dr Unit E
- 3150 N Yarbrough Dr Unit E
- 3150 N Yarbrough Dr Unit E
- 3150 N Yarbrough Dr Unit E
- 3150 N Yarbrough Dr Unit E
- 3150 N Yarbrough Dr Unit D
- 3150 N Yarbrough Dr Unit D
- 3150 N Yarbrough Dr Unit D
- 3150 N Yarbrough Dr Unit D
- 3150 N Yarbrough Dr Unit D
- 3150 N Yarbrough Dr Unit D
Your Personal Tour Guide
Ask me questions while you tour the home.