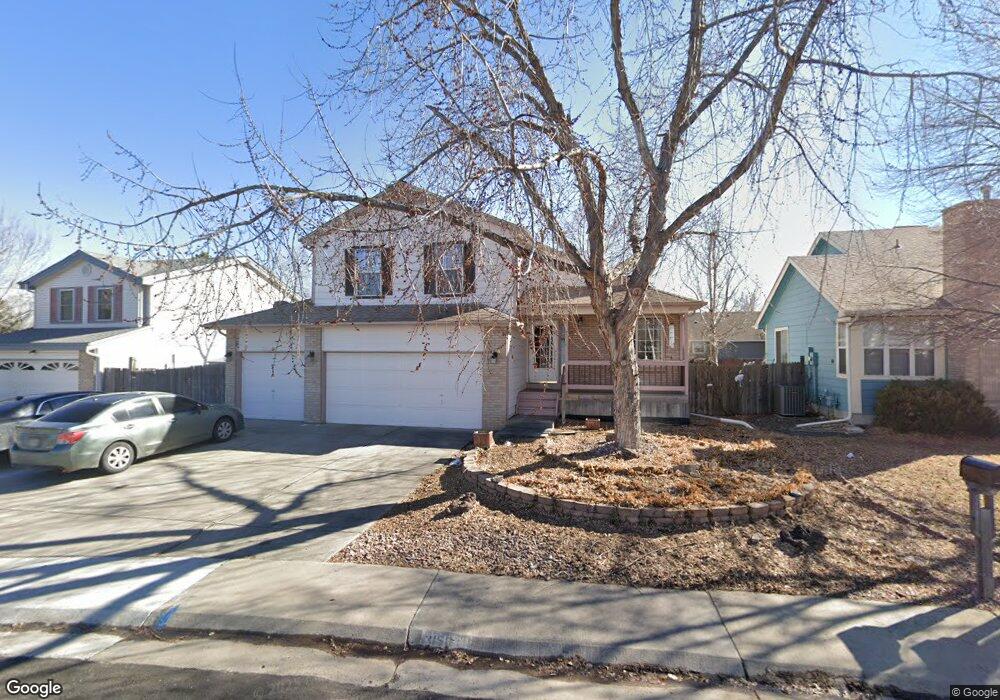
3150 Prince Cir Broomfield, CO 80020
Westlake Village NeighborhoodEstimated Value: $605,000 - $630,000
5
Beds
4
Baths
2,072
Sq Ft
$300/Sq Ft
Est. Value
About This Home
This home is located at 3150 Prince Cir, Broomfield, CO 80020 and is currently estimated at $621,368, approximately $299 per square foot. 3150 Prince Cir is a home located in Broomfield County with nearby schools including Centennial Elementary School, Westlake Middle School, and Legacy High School.
Ownership History
Date
Name
Owned For
Owner Type
Purchase Details
Closed on
Jul 20, 2018
Sold by
Holcomb W Ellis
Bought by
Treasure Shauna
Current Estimated Value
Home Financials for this Owner
Home Financials are based on the most recent Mortgage that was taken out on this home.
Original Mortgage
$4,198,265
Outstanding Balance
$3,638,424
Interest Rate
4.5%
Mortgage Type
FHA
Estimated Equity
-$3,017,056
Purchase Details
Closed on
Oct 24, 2002
Sold by
Stinehelfer David J and Stinehelfer Francisca M R
Bought by
Holcomb W Ellis and Elaine Holcomb M
Home Financials for this Owner
Home Financials are based on the most recent Mortgage that was taken out on this home.
Original Mortgage
$246,039
Interest Rate
6.13%
Mortgage Type
FHA
Purchase Details
Closed on
Sep 27, 1996
Sold by
Way Kyle J And
Bought by
Stinehelfer David J and Stinehelfer Franci
Purchase Details
Closed on
Jun 28, 1993
Purchase Details
Closed on
Feb 24, 1993
Purchase Details
Closed on
Feb 26, 1992
Create a Home Valuation Report for This Property
The Home Valuation Report is an in-depth analysis detailing your home's value as well as a comparison with similar homes in the area
Home Values in the Area
Average Home Value in this Area
Purchase History
| Date | Buyer | Sale Price | Title Company |
|---|---|---|---|
| Treasure Shauna | $427,000 | Land Title Guarantee Co | |
| Holcomb W Ellis | $249,900 | North American Title Co | |
| Stinehelfer David J | $149,900 | -- | |
| -- | $121,200 | -- | |
| -- | -- | -- | |
| -- | $7,500 | -- | |
| -- | -- | -- |
Source: Public Records
Mortgage History
| Date | Status | Borrower | Loan Amount |
|---|---|---|---|
| Open | Treasure Shauna | $4,198,265 | |
| Previous Owner | Holcomb W Ellis | $246,039 |
Source: Public Records
Tax History Compared to Growth
Tax History
| Year | Tax Paid | Tax Assessment Tax Assessment Total Assessment is a certain percentage of the fair market value that is determined by local assessors to be the total taxable value of land and additions on the property. | Land | Improvement |
|---|---|---|---|---|
| 2025 | $3,969 | $37,880 | $8,710 | $29,170 |
| 2024 | $3,969 | $37,010 | $7,920 | $29,090 |
| 2023 | $3,932 | $42,220 | $9,040 | $33,180 |
| 2022 | $3,447 | $30,510 | $6,150 | $24,360 |
| 2021 | $3,555 | $31,400 | $6,330 | $25,070 |
| 2020 | $3,444 | $30,090 | $5,900 | $24,190 |
| 2019 | $3,446 | $30,300 | $5,940 | $24,360 |
| 2018 | $3,040 | $25,780 | $4,570 | $21,210 |
| 2017 | $2,770 | $28,500 | $5,050 | $23,450 |
| 2016 | $2,390 | $21,680 | $5,050 | $16,630 |
| 2015 | $2,390 | $18,200 | $5,050 | $13,150 |
| 2014 | $2,062 | $18,200 | $5,050 | $13,150 |
Source: Public Records
Map
Nearby Homes
- 3080 S Princess Cir
- 3111 W 127th Ave
- 3006 W 127th Ave
- 3202 Columbine Ct
- 13050 Hazel Ct
- 12639 James Ct
- 12805 King St
- 13010 King Cir
- 13005 Lowell Ct
- 2885 E Midway Blvd Unit 1309
- 2885 E Midway Blvd Unit 188
- 2885 E Midway Blvd Unit 204
- 2885 E Midway Blvd Unit 117
- 2885 E Midway Blvd Unit 1127
- 2885 E Midway Blvd Unit 1256
- 2885 E Midway Blvd Unit 1224
- 2885 E Midway Blvd Unit 401
- 2885 E Midway Blvd Unit 1417
- 2885 E Midway Blvd Unit 448
- 2885 E Midway Blvd Unit 501
- 3160 Prince Cir
- 3140 Prince Cir
- 3170 Prince Cir
- 3151 Prince Cir
- 3136 Prince Cir
- 3151 Queen Ct
- 3141 Queen Ct
- 3161 Prince Cir
- 3161 Queen Ct
- 3130 Prince Cir
- 3180 Prince Cir
- 3131 Queen Ct
- 3171 Queen Ct
- 3171 Prince Cir
- 3141 Prince Cir
- 3120 Prince Cir
- 3181 Queen Ct
- 3181 Prince Cir
- 3190 Prince Cir
- 3110 Prince Cir