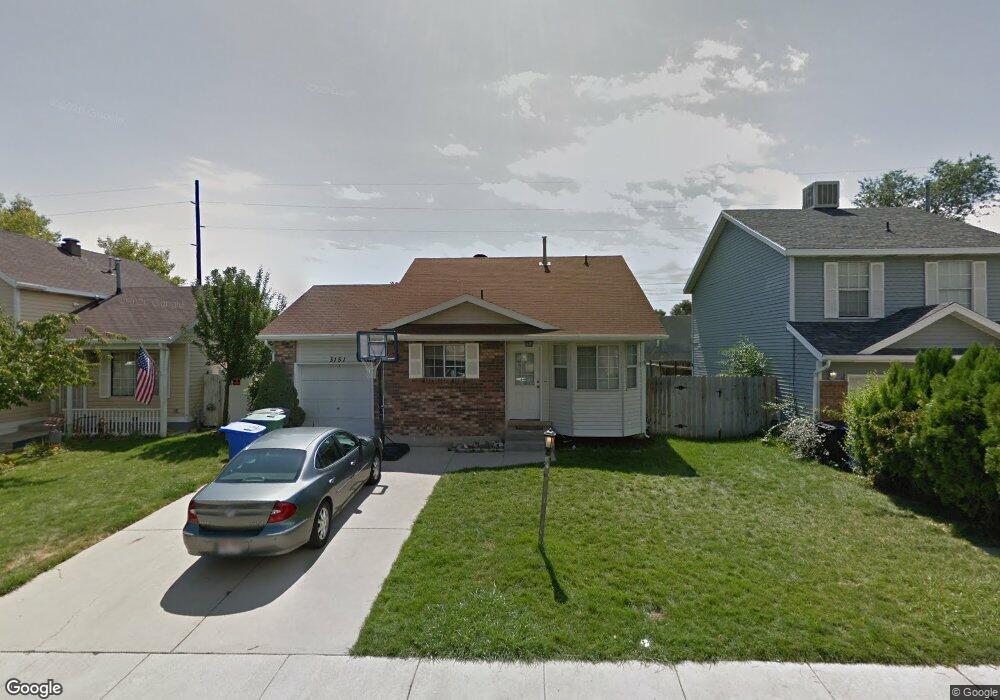
3151 W 8565 S West Jordan, UT 84088
Estimated Value: $416,000 - $673,000
3
Beds
1
Bath
2,465
Sq Ft
$203/Sq Ft
Est. Value
About This Home
This home is located at 3151 W 8565 S, West Jordan, UT 84088 and is currently estimated at $501,451, approximately $203 per square foot. 3151 W 8565 S is a home located in Salt Lake County with nearby schools including Terra Linda Elementary School, Joel P. Jensen Middle School, and West Jordan High School.
Ownership History
Date
Name
Owned For
Owner Type
Purchase Details
Closed on
Mar 4, 2009
Sold by
Wu Yung C and Wu Chung Y
Bought by
Wu Chung Y and The Jimmy Wu Living Trust
Current Estimated Value
Purchase Details
Closed on
Jul 7, 2008
Sold by
Euler Janell L
Bought by
Wu Yung C and Wu Chung Y
Purchase Details
Closed on
Apr 26, 2007
Sold by
Browning Paul Phillip and Browning Joleen
Bought by
Euler Janell L
Home Financials for this Owner
Home Financials are based on the most recent Mortgage that was taken out on this home.
Original Mortgage
$147,000
Interest Rate
6.11%
Mortgage Type
Unknown
Purchase Details
Closed on
Aug 5, 1998
Sold by
Montgomery Byron K and Montgomery Heather B
Bought by
Browning Paul Philip and Browning Joleen
Create a Home Valuation Report for This Property
The Home Valuation Report is an in-depth analysis detailing your home's value as well as a comparison with similar homes in the area
Home Values in the Area
Average Home Value in this Area
Purchase History
| Date | Buyer | Sale Price | Title Company |
|---|---|---|---|
| Wu Chung Y | -- | Equity Title | |
| Wu Yung C | $172,921 | None Available | |
| Euler Janell L | -- | Equity Title | |
| Browning Paul Philip | -- | Superior Title Company |
Source: Public Records
Mortgage History
| Date | Status | Borrower | Loan Amount |
|---|---|---|---|
| Previous Owner | Euler Janell L | $147,000 |
Source: Public Records
Tax History Compared to Growth
Tax History
| Year | Tax Paid | Tax Assessment Tax Assessment Total Assessment is a certain percentage of the fair market value that is determined by local assessors to be the total taxable value of land and additions on the property. | Land | Improvement |
|---|---|---|---|---|
| 2025 | $1,858 | $362,600 | $106,800 | $255,800 |
| 2024 | $1,858 | $357,500 | $104,800 | $252,700 |
| 2023 | $1,901 | $344,700 | $100,800 | $243,900 |
| 2022 | $0 | $354,400 | $98,800 | $255,600 |
| 2021 | $1,687 | $273,900 | $70,400 | $203,500 |
| 2020 | $1,589 | $242,200 | $70,400 | $171,800 |
| 2019 | $1,583 | $236,600 | $70,400 | $166,200 |
| 2018 | $1,371 | $203,200 | $67,700 | $135,500 |
| 2017 | $1,244 | $183,600 | $67,700 | $115,900 |
| 2016 | $1,295 | $179,500 | $67,700 | $111,800 |
| 2015 | $1,281 | $173,200 | $68,900 | $104,300 |
| 2014 | $1,326 | $186,200 | $70,200 | $116,000 |
Source: Public Records
Map
Nearby Homes
- 8493 S 3200 W
- 3112 Green Acre Dr
- 8407 Meadow Green Way
- 2990 W 8870 S
- 3214 W Monterey Pine Ln
- 3542 W Franco Ct Unit 4
- 4000 W 8400 S Unit 83
- 2970 W 8870 S
- 8180 S Old Bingham Hwy
- 8461 S Meadowlark Ln
- 3332 Lower Newark Way
- 8886 S 2700 W
- 8058 S Lismore Ln Unit 304
- 7987 S 2980 W
- 7993 S 2760 W
- 7968 S 2700 W
- 8461 S 2385 W
- 3066 W Linton Dr
- 77 Rio Bravo Place
- 48 San Rafael Ct