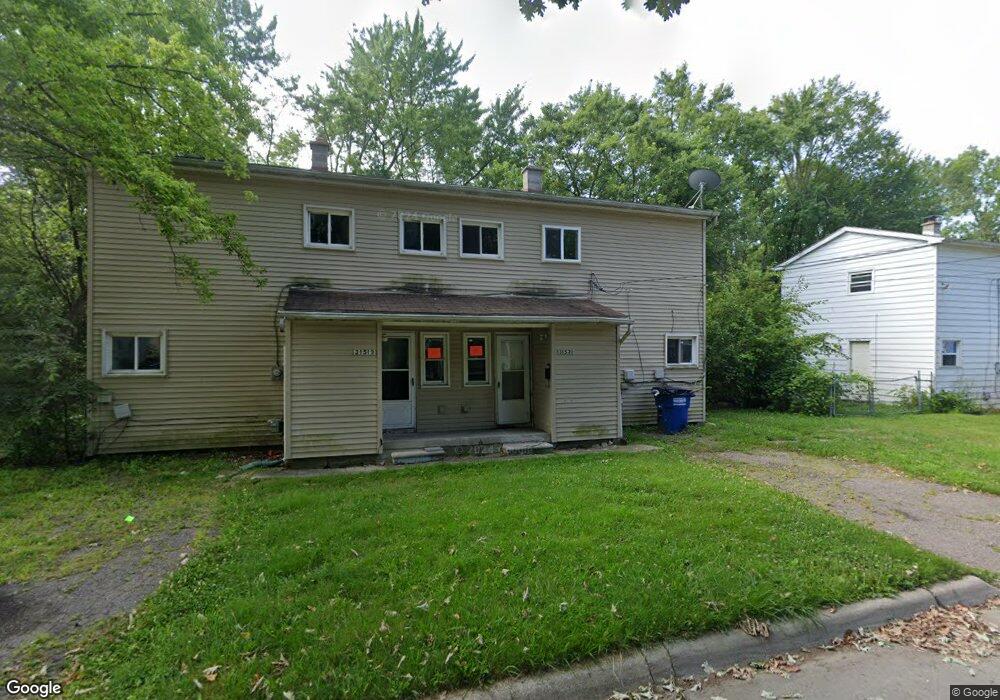
31519 Alpena Ct Westland, MI 48186
Estimated Value: $129,000 - $207,000
6
Beds
2
Baths
1,728
Sq Ft
$89/Sq Ft
Est. Value
About This Home
This home is located at 31519 Alpena Ct, Westland, MI 48186 and is currently estimated at $153,578, approximately $88 per square foot. 31519 Alpena Ct is a home located in Wayne County with nearby schools including Eugene B. Elliott Elementary School, Adams Middle School, and Benjamin Franklin Middle School.
Ownership History
Date
Name
Owned For
Owner Type
Purchase Details
Closed on
May 10, 2019
Sold by
Duplido Properties 2018 Llc
Bought by
Pixel Us Limited Partnership
Current Estimated Value
Home Financials for this Owner
Home Financials are based on the most recent Mortgage that was taken out on this home.
Original Mortgage
$1,890,000
Outstanding Balance
$1,654,908
Interest Rate
4%
Mortgage Type
Commercial
Estimated Equity
-$1,501,330
Purchase Details
Closed on
Dec 18, 2018
Sold by
Nguyen Le
Bought by
Duplido Properties 2018 Llc
Purchase Details
Closed on
Jun 14, 2011
Sold by
Bac Home Loans Servicing L P
Bought by
Fannie Mae
Purchase Details
Closed on
May 25, 2011
Sold by
Honeycutt Charles L and Honeycutt Sue L
Bought by
Bac Home Loans Servicing L P
Purchase Details
Closed on
Nov 1, 1995
Sold by
Rice Bennie A and Rice Edna A
Bought by
Rice Bennie A and Rice Edna A
Purchase Details
Closed on
May 10, 1995
Sold by
Janet V Rudzinski
Bought by
Rice Bennie A and Rice Edna A
Create a Home Valuation Report for This Property
The Home Valuation Report is an in-depth analysis detailing your home's value as well as a comparison with similar homes in the area
Home Values in the Area
Average Home Value in this Area
Purchase History
| Date | Buyer | Sale Price | Title Company |
|---|---|---|---|
| Pixel Us Limited Partnership | $270,000 | None Available | |
| Duplido Properties 2018 Llc | $650,000 | Standard Title Agency Llc | |
| Fannie Mae | -- | None Available | |
| Bac Home Loans Servicing L P | $10,900 | None Available | |
| Rice Bennie A | $25,000 | -- | |
| Rice Bennie A | $25,000 | -- |
Source: Public Records
Mortgage History
| Date | Status | Borrower | Loan Amount |
|---|---|---|---|
| Open | Pixel Us Limited Partnership | $1,890,000 |
Source: Public Records
Tax History Compared to Growth
Tax History
| Year | Tax Paid | Tax Assessment Tax Assessment Total Assessment is a certain percentage of the fair market value that is determined by local assessors to be the total taxable value of land and additions on the property. | Land | Improvement |
|---|---|---|---|---|
| 2025 | $2,061 | $58,500 | $0 | $0 |
| 2024 | $2,061 | $44,000 | $0 | $0 |
| 2023 | $2,191 | $38,300 | $0 | $0 |
| 2022 | $2,008 | $34,300 | $0 | $0 |
| 2021 | $2,609 | $32,700 | $0 | $0 |
| 2020 | $2,744 | $27,600 | $0 | $0 |
| 2019 | $1,490 | $21,200 | $0 | $0 |
| 2018 | $1,593 | $19,500 | $0 | $0 |
| 2017 | $345 | $17,900 | $0 | $0 |
| 2016 | $952 | $14,700 | $0 | $0 |
| 2015 | $1,293 | $13,180 | $0 | $0 |
| 2013 | $1,594 | $16,600 | $0 | $0 |
| 2012 | $1,789 | $19,790 | $0 | $0 |
Source: Public Records
Map
Nearby Homes
- 31913 Roscommon St
- 31612 Antrim Ct
- 31923 Calhoun Ct
- 31784 Arenac Ct
- 32046 Cheboygan Ct
- 31820 Bay Ct
- 31842 Bay Ct
- 32317 Ogemaw St
- 1682 Beatrice St
- 32462 Muskegon Ct
- 32116 Palmer Rd
- 32332 Kalamazoo Ct
- 32140 Palmer Rd
- 3512 Barry St
- 32155 Melton St
- 30779 Middlebury St
- 32154 Melton St
- 32538 Woodbrook Dr
- 33012 Akron St
- 32572 Woodbrook Dr
- 31515 Alpena Ct
- 31465 Alcona Ct
- 31523 Alpena Ct
- 31469 Alcona Ct
- 31518 Alpena Ct
- 31520 Alpena Ct
- 31463 Alcona Ct
- 31511 Alpena Ct
- 31516 Alpena Ct
- 31522 Alpena Ct
- 31473 Alcona Ct
- 31512 Alpena Ct
- 31529 Alpena Ct
- 31461 Alcona Ct
- 31510 Alpena Ct
- 31550 Alpena Ct
- 31507 Alpena Ct
- 31468 Alcona Ct
- 31470 Alcona Ct
- 31554 Alpena Ct