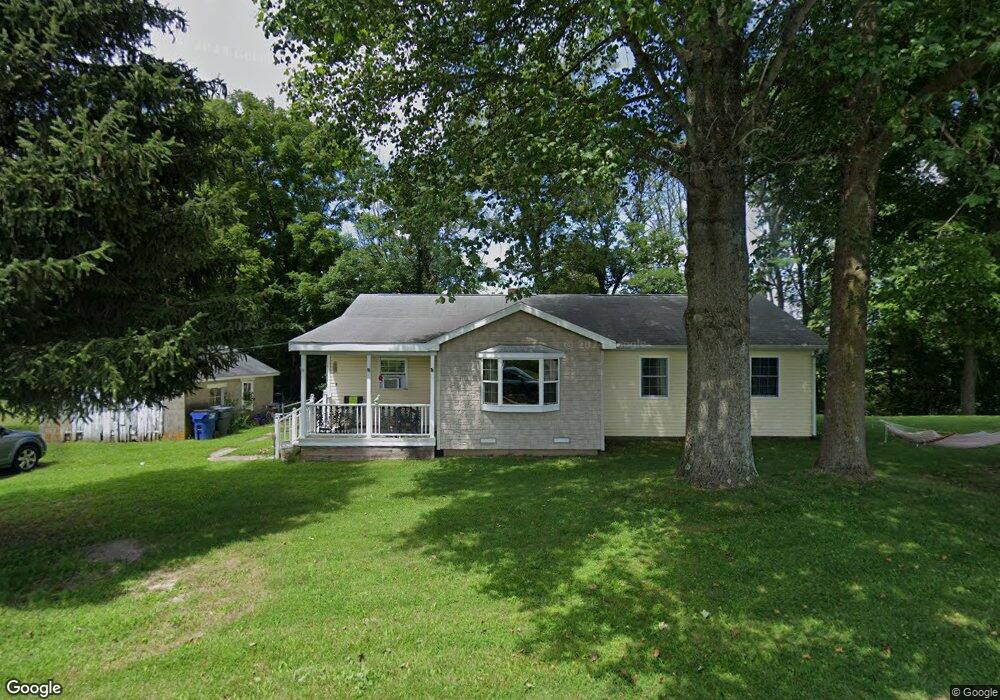
3152 E 200 N Rushville, IN 46173
Estimated Value: $106,000 - $385,000
2
Beds
1
Bath
1,304
Sq Ft
$154/Sq Ft
Est. Value
About This Home
This home is located at 3152 E 200 N, Rushville, IN 46173 and is currently estimated at $200,307, approximately $153 per square foot. 3152 E 200 N is a home located in Rush County with nearby schools including Rushville Consolidated High School.
Ownership History
Date
Name
Owned For
Owner Type
Purchase Details
Closed on
May 1, 2018
Sold by
Clines Marvin J
Bought by
Sharp Tyler W and Sharp Emily A
Current Estimated Value
Home Financials for this Owner
Home Financials are based on the most recent Mortgage that was taken out on this home.
Original Mortgage
$76,500
Outstanding Balance
$65,945
Interest Rate
4.45%
Mortgage Type
New Conventional
Estimated Equity
$134,362
Purchase Details
Closed on
Aug 25, 2008
Sold by
Clines Michelle E and Clinesstanley Michelle E
Bought by
Clines Marvin J
Home Financials for this Owner
Home Financials are based on the most recent Mortgage that was taken out on this home.
Original Mortgage
$45,000
Interest Rate
6.42%
Mortgage Type
New Conventional
Create a Home Valuation Report for This Property
The Home Valuation Report is an in-depth analysis detailing your home's value as well as a comparison with similar homes in the area
Home Values in the Area
Average Home Value in this Area
Purchase History
| Date | Buyer | Sale Price | Title Company |
|---|---|---|---|
| Sharp Tyler W | -- | None Available | |
| Clines Marvin J | -- | None Available |
Source: Public Records
Mortgage History
| Date | Status | Borrower | Loan Amount |
|---|---|---|---|
| Open | Sharp Tyler W | $76,500 | |
| Previous Owner | Clines Marvin J | $45,000 |
Source: Public Records
Tax History Compared to Growth
Tax History
| Year | Tax Paid | Tax Assessment Tax Assessment Total Assessment is a certain percentage of the fair market value that is determined by local assessors to be the total taxable value of land and additions on the property. | Land | Improvement |
|---|---|---|---|---|
| 2024 | $525 | $122,900 | $25,500 | $97,400 |
| 2023 | $529 | $115,800 | $23,600 | $92,200 |
| 2022 | $468 | $101,900 | $21,600 | $80,300 |
| 2021 | $400 | $90,200 | $18,800 | $71,400 |
| 2020 | $347 | $85,200 | $17,700 | $67,500 |
| 2019 | $293 | $81,500 | $17,700 | $63,800 |
| 2018 | $267 | $79,900 | $17,700 | $62,200 |
| 2017 | $232 | $78,700 | $17,700 | $61,000 |
| 2016 | $221 | $78,500 | $17,700 | $60,800 |
| 2014 | $158 | $66,400 | $17,700 | $48,700 |
| 2013 | $158 | $66,700 | $17,700 | $49,000 |
Source: Public Records
Map
Nearby Homes