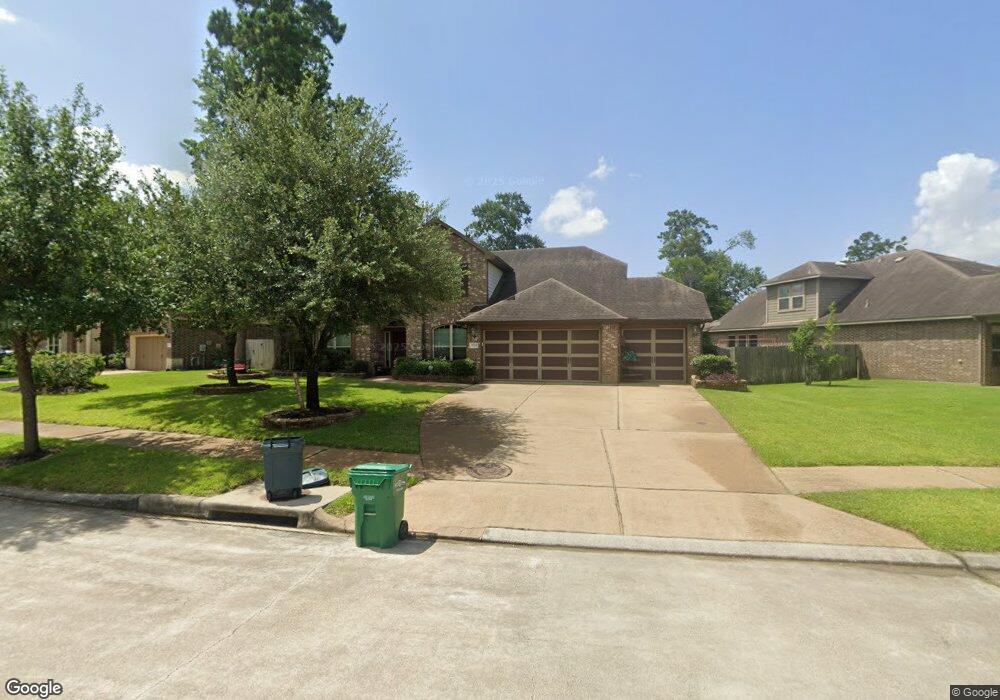
31545 Ember Trail Ln Spring, TX 77386
Imperial Oaks NeighborhoodEstimated Value: $421,491 - $491,000
4
Beds
4
Baths
3,061
Sq Ft
$152/Sq Ft
Est. Value
About This Home
This home is located at 31545 Ember Trail Ln, Spring, TX 77386 and is currently estimated at $464,123, approximately $151 per square foot. 31545 Ember Trail Ln is a home located in Montgomery County with nearby schools including Birnham Woods Elementary School, York J High School, and Grand Oaks High School.
Ownership History
Date
Name
Owned For
Owner Type
Purchase Details
Closed on
May 31, 2016
Sold by
Moreno Mario and Moreno Erica Jeannette
Bought by
Ihrke David Paul and Ihrke Colleen M
Current Estimated Value
Home Financials for this Owner
Home Financials are based on the most recent Mortgage that was taken out on this home.
Original Mortgage
$302,874
Outstanding Balance
$135,641
Interest Rate
3.59%
Mortgage Type
VA
Estimated Equity
$328,482
Purchase Details
Closed on
Oct 26, 2012
Sold by
Weekley Homes Llc
Bought by
Moreno Mario and Moreno Erica Jeannette
Home Financials for this Owner
Home Financials are based on the most recent Mortgage that was taken out on this home.
Original Mortgage
$208,765
Interest Rate
3.52%
Mortgage Type
New Conventional
Purchase Details
Closed on
Jun 25, 2012
Sold by
Imperial Oaks Development Corp
Bought by
Ihrke David P and Ihrke Colleen M
Create a Home Valuation Report for This Property
The Home Valuation Report is an in-depth analysis detailing your home's value as well as a comparison with similar homes in the area
Home Values in the Area
Average Home Value in this Area
Purchase History
| Date | Buyer | Sale Price | Title Company |
|---|---|---|---|
| Ihrke David Paul | -- | None Available | |
| Moreno Mario | -- | Priority Title | |
| Ihrke David P | -- | -- |
Source: Public Records
Mortgage History
| Date | Status | Borrower | Loan Amount |
|---|---|---|---|
| Open | Ihrke David Paul | $302,874 | |
| Previous Owner | Moreno Mario | $208,765 |
Source: Public Records
Tax History
| Year | Tax Paid | Tax Assessment Tax Assessment Total Assessment is a certain percentage of the fair market value that is determined by local assessors to be the total taxable value of land and additions on the property. | Land | Improvement |
|---|---|---|---|---|
| 2025 | $9,456 | $410,000 | $68,000 | $342,000 |
| 2024 | $8,730 | $434,335 | -- | -- |
| 2023 | $8,730 | $394,850 | $68,000 | $373,560 |
| 2022 | $10,141 | $358,950 | $35,030 | $386,780 |
| 2021 | $10,014 | $326,320 | $35,030 | $291,290 |
| 2020 | $10,124 | $312,050 | $35,030 | $277,020 |
| 2019 | $10,516 | $315,370 | $35,030 | $280,340 |
| 2018 | $9,159 | $294,620 | $35,030 | $259,590 |
| 2017 | $9,904 | $294,620 | $35,030 | $259,590 |
| 2016 | $10,082 | $299,920 | $35,030 | $264,890 |
| 2015 | $8,780 | $292,490 | $35,030 | $264,890 |
| 2014 | $8,780 | $265,900 | $35,030 | $247,930 |
Source: Public Records
Map
Nearby Homes
- 31563 Ember Trail Ln
- 31525 Ember Trail Ln
- 3301 Asbury Glen Ct
- 3018 Silverwood Park Ln
- 31410 Ashland Park Ln
- 31607 Summit Springs Ln
- 31731 Redbud Blossom Ln
- 31920 Scarlet Tupelo Way
- 3320 Atwood Creek Ct
- 2907 Bright Sky Ct
- 3002 Rusty Bridge Ct
- 31306 Summit Grove Ln
- 2710 Fountainbrook Park Ct
- 31992 Retama Ranch Dr
- 3619 Beacon Green Ln
- 31969 Retama Ranch Dr
- 31969 Retama Ranch Ln
- 2898 Woodland Glen Ln
- 31973 Retama Ranch Dr
- 31973 Retama Ranch Ln
- 31539 Ember Trail Ln
- 31549 Ember Trail Ln
- 31526 Reston Cliff Ct
- 31535 Ember Trail Ln
- 31522 Reston Cliff Ct
- 31544 Ember Trail Ln
- 31550 Ember Trail Ln
- 31540 Ember Trail Ln
- 31554 Ember Trail Ln
- 31577 Ember Trail Ln
- 31529 Ember Trail Ln
- 31536 Ember Trail Ln
- 31558 Ember Trail Ln
- 31518 Reston Cliff Ct
- 31523 Reston Cliff Ct
- 31532 Ember Trail Ln
- 31581 Ember Trail Ln
- 31562 Ember Trail Ln
- 3309 Starlight Hill Ct
- 3305 Starlight Hill Ct
Your Personal Tour Guide
Ask me questions while you tour the home.