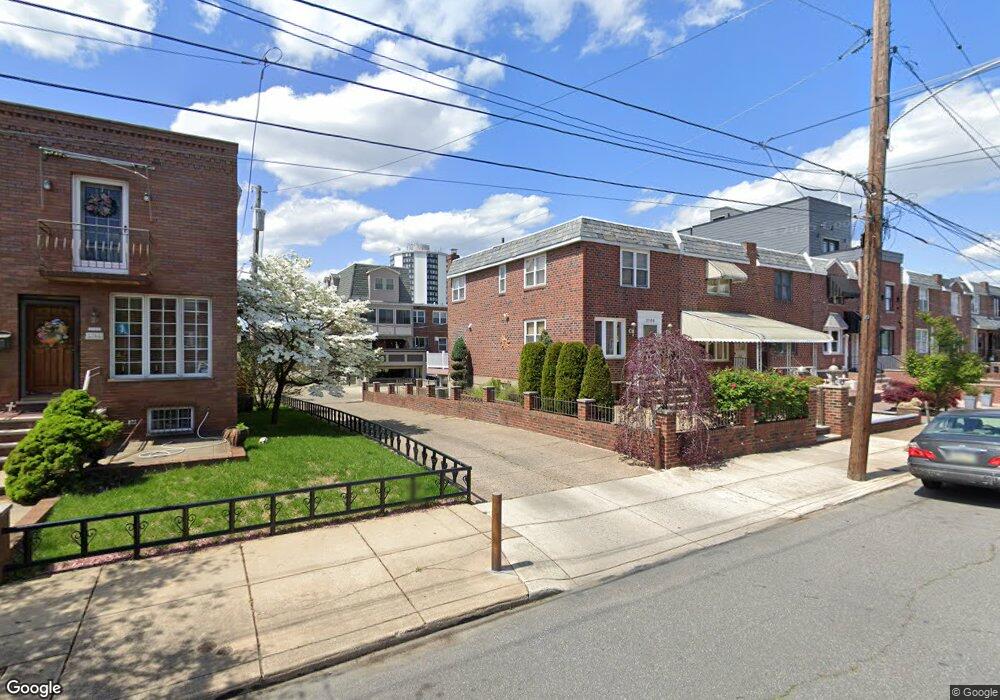
3156 S Uber St Philadelphia, PA 19145
South Philadelphia West NeighborhoodEstimated Value: $445,000 - $477,000
3
Beds
2
Baths
1,152
Sq Ft
$401/Sq Ft
Est. Value
About This Home
This home is located at 3156 S Uber St, Philadelphia, PA 19145 and is currently estimated at $461,840, approximately $400 per square foot. 3156 S Uber St is a home located in Philadelphia County with nearby schools including F. Amedee Bregy School, South Philadelphia High School, and Philadelphia Performing Arts Charter School.
Ownership History
Date
Name
Owned For
Owner Type
Purchase Details
Closed on
Dec 13, 2010
Sold by
Gentile Nicholas and Gentile Lerae
Bought by
Mastrangelo Rosanna
Current Estimated Value
Home Financials for this Owner
Home Financials are based on the most recent Mortgage that was taken out on this home.
Original Mortgage
$272,800
Interest Rate
4.88%
Mortgage Type
New Conventional
Purchase Details
Closed on
Oct 20, 2004
Sold by
Gentile Nicholas
Bought by
Gentile Nicholas and Gentile Lerae
Purchase Details
Closed on
Aug 27, 2002
Sold by
Perri Maria
Bought by
Gentile Nicholas
Home Financials for this Owner
Home Financials are based on the most recent Mortgage that was taken out on this home.
Original Mortgage
$163,706
Interest Rate
6.55%
Mortgage Type
FHA
Purchase Details
Closed on
Mar 26, 2002
Sold by
Perri Raymond F
Bought by
Perri Marie
Purchase Details
Closed on
Mar 4, 1996
Sold by
Perri Frank and Perri Marie
Bought by
Perri Raymond F
Create a Home Valuation Report for This Property
The Home Valuation Report is an in-depth analysis detailing your home's value as well as a comparison with similar homes in the area
Home Values in the Area
Average Home Value in this Area
Purchase History
| Date | Buyer | Sale Price | Title Company |
|---|---|---|---|
| Mastrangelo Rosanna | $360,000 | None Available | |
| Gentile Nicholas | -- | -- | |
| Gentile Nicholas | $165,000 | -- | |
| Perri Marie | -- | -- | |
| Perri Raymond F | -- | -- |
Source: Public Records
Mortgage History
| Date | Status | Borrower | Loan Amount |
|---|---|---|---|
| Previous Owner | Mastrangelo Rosanna | $272,800 | |
| Previous Owner | Gentile Nicholas | $163,706 |
Source: Public Records
Tax History Compared to Growth
Tax History
| Year | Tax Paid | Tax Assessment Tax Assessment Total Assessment is a certain percentage of the fair market value that is determined by local assessors to be the total taxable value of land and additions on the property. | Land | Improvement |
|---|---|---|---|---|
| 2025 | $4,450 | $423,800 | $84,760 | $339,040 |
| 2024 | $4,450 | $423,800 | $84,760 | $339,040 |
| 2023 | $4,450 | $317,900 | $63,580 | $254,320 |
| 2022 | $5,008 | $272,900 | $63,580 | $209,320 |
| 2021 | $5,638 | $0 | $0 | $0 |
| 2020 | $5,638 | $0 | $0 | $0 |
| 2019 | $5,241 | $0 | $0 | $0 |
| 2018 | $4,702 | $0 | $0 | $0 |
| 2017 | $5,122 | $0 | $0 | $0 |
| 2016 | $4,702 | $0 | $0 | $0 |
| 2015 | $4,501 | $0 | $0 | $0 |
| 2014 | -- | $365,900 | $65,136 | $300,764 |
| 2012 | -- | $31,232 | $8,225 | $23,007 |
Source: Public Records
Map
Nearby Homes
- 3183 S 20th St
- 3187 S 20th St
- 3135 S Uber St
- 3329 S 20th St
- 3217 Davinci Dr
- 1843 Hartranft St Unit B101
- 1816 Schley St
- 3516 S 20th St
- 1711 Packer Ave
- 3010 S Colorado St
- 3015 S Colorado St
- 2002 Renaissance Walk
- 2006 Renaissance Walk
- 2124 W Reserve Dr
- 3017 S 17th St
- 1524 Curtin St
- 1503 Packer Ave
- 3408 Pietro Way
- 2843 S 17th St
- 2425 Hartranft St