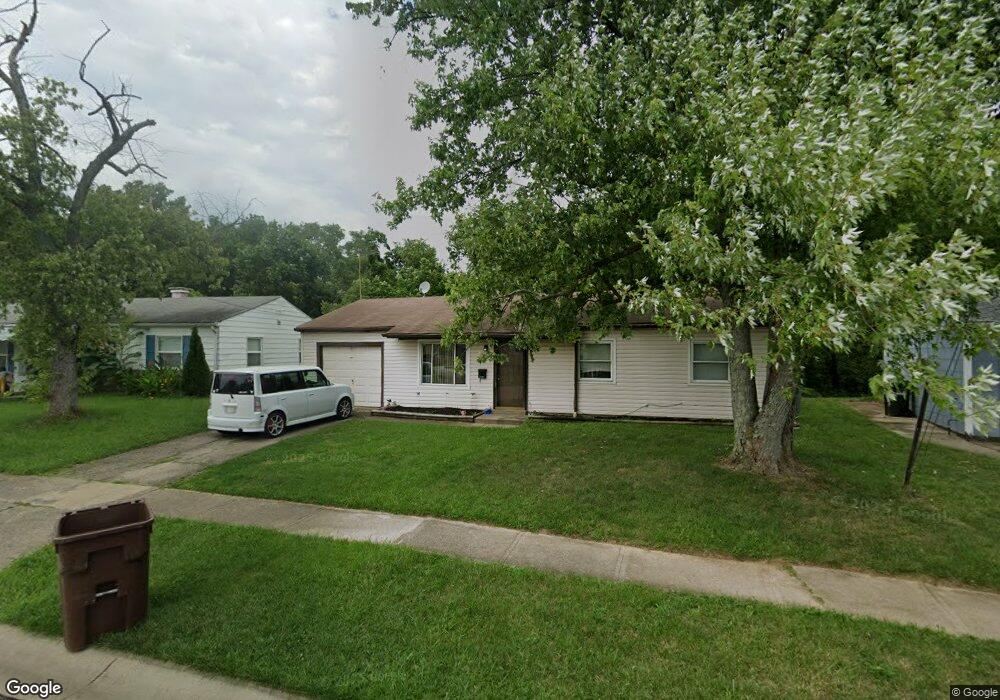
3158 Deshler Dr Cincinnati, OH 45251
Estimated Value: $124,000 - $158,502
3
Beds
1
Bath
925
Sq Ft
$155/Sq Ft
Est. Value
About This Home
This home is located at 3158 Deshler Dr, Cincinnati, OH 45251 and is currently estimated at $143,126, approximately $154 per square foot. 3158 Deshler Dr is a home located in Hamilton County with nearby schools including Taylor Elementary School, Pleasant Run Elementary School, and Pleasant Run Middle School.
Ownership History
Date
Name
Owned For
Owner Type
Purchase Details
Closed on
Aug 26, 2009
Sold by
Tristate Investments Llc
Bought by
Bierman James J
Current Estimated Value
Purchase Details
Closed on
Sep 24, 2006
Sold by
Yeazell Michael R and Yeazell Erin N
Bought by
Tristate Investments Llc
Purchase Details
Closed on
Jul 26, 2006
Sold by
Bank Of New York
Bought by
Yeazell Michael R and Yeazell Lee P
Purchase Details
Closed on
Jun 6, 2006
Sold by
Swartwout Jason M and Swartwout Jessica A
Bought by
Bank Of New York and Cwabs 2004-12
Purchase Details
Closed on
Oct 25, 1999
Sold by
Ostendorf David G
Bought by
Swartwout Jason M
Home Financials for this Owner
Home Financials are based on the most recent Mortgage that was taken out on this home.
Original Mortgage
$69,870
Interest Rate
7.78%
Mortgage Type
VA
Create a Home Valuation Report for This Property
The Home Valuation Report is an in-depth analysis detailing your home's value as well as a comparison with similar homes in the area
Home Values in the Area
Average Home Value in this Area
Purchase History
| Date | Buyer | Sale Price | Title Company |
|---|---|---|---|
| Bierman James J | $28,000 | Attorney | |
| Tristate Investments Llc | -- | None Available | |
| Yeazell Michael R | $53,000 | Resource Title Agency Inc | |
| Bank Of New York | $50,000 | None Available | |
| Swartwout Jason M | $68,500 | -- |
Source: Public Records
Mortgage History
| Date | Status | Borrower | Loan Amount |
|---|---|---|---|
| Previous Owner | Swartwout Jason M | $69,870 |
Source: Public Records
Tax History Compared to Growth
Tax History
| Year | Tax Paid | Tax Assessment Tax Assessment Total Assessment is a certain percentage of the fair market value that is determined by local assessors to be the total taxable value of land and additions on the property. | Land | Improvement |
|---|---|---|---|---|
| 2024 | $1,924 | $34,098 | $9,300 | $24,798 |
| 2023 | $1,998 | $34,098 | $9,300 | $24,798 |
| 2022 | $1,636 | $23,968 | $8,197 | $15,771 |
| 2021 | $1,652 | $23,968 | $8,197 | $15,771 |
| 2020 | $1,633 | $23,968 | $8,197 | $15,771 |
| 2019 | $1,420 | $19,331 | $6,612 | $12,719 |
| 2018 | $1,278 | $19,331 | $6,612 | $12,719 |
| 2017 | $1,229 | $19,331 | $6,612 | $12,719 |
| 2016 | $614 | $9,311 | $6,675 | $2,636 |
| 2015 | $611 | $9,311 | $6,675 | $2,636 |
| 2014 | $613 | $9,311 | $6,675 | $2,636 |
| 2013 | $615 | $9,801 | $7,025 | $2,776 |
Source: Public Records
Map
Nearby Homes
- 9717 Loralinda Dr
- 3013 Niagara St
- 9828 Loralinda Dr
- 3246 Ainsworth Dr
- 3275 Deshler Dr
- 3276 Deshler Dr
- 9738 Gibralter Dr
- 9974 Marino Dr
- 9562 Trafalgar Ct
- 3151 Birchway Dr Unit 3151
- 9712 Manhattan Dr
- 9737 Dunraven Dr
- 9977 Dunraven Dr
- 2702 Niagara St
- 3351 Deshler Dr
- 2788 Hazelton Ct
- 9558 Woodstate Dr Unit 13E
- 9568 Woodstate Dr
- 3374 Deshler Dr
- 9446 Haddington Ct
- 3150 Deshler Dr
- 3172 Deshler Dr
- 3153 Deshler Dr
- 3163 Deshler Dr
- 3180 Deshler Dr
- 3136 Deshler Dr
- 3139 Deshler Dr
- 3175 Deshler Dr
- 3188 Deshler Dr
- 3131 Deshler Dr
- 3183 Deshler Dr
- 3128 Deshler Dr
- 3160 Palmyra Dr
- 3168 Palmyra Dr
- 3191 Deshler Dr
- 3120 Deshler Dr
- 3178 Palmyra Dr
- 3196 Deshler Dr
- 9760 Loralinda Dr
- 3150 Palmyra Dr