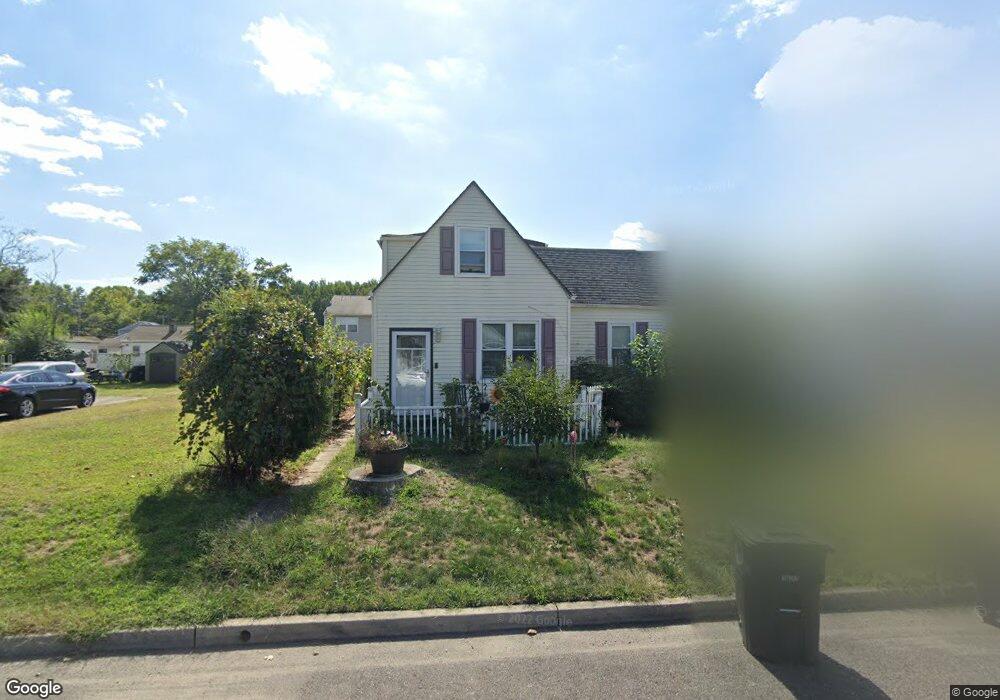
316 9th Ave Lindenwold, NJ 08021
Estimated Value: $258,000 - $307,000
3
Beds
2
Baths
1,384
Sq Ft
$202/Sq Ft
Est. Value
About This Home
This home is located at 316 9th Ave, Lindenwold, NJ 08021 and is currently estimated at $279,076, approximately $201 per square foot. 316 9th Ave is a home located in Camden County with nearby schools including Memorial Middle School, Lindenwold High School, and South Jersey Sudbury School.
Ownership History
Date
Name
Owned For
Owner Type
Purchase Details
Closed on
Dec 14, 2006
Sold by
Wheeler Lenore H
Bought by
Beldan Laurentiu and Beldan Dumitruta
Current Estimated Value
Home Financials for this Owner
Home Financials are based on the most recent Mortgage that was taken out on this home.
Original Mortgage
$120,000
Outstanding Balance
$71,666
Interest Rate
6.29%
Estimated Equity
$207,410
Purchase Details
Closed on
May 1, 2006
Sold by
Lopez Victor M
Bought by
Wheeler Lenore
Home Financials for this Owner
Home Financials are based on the most recent Mortgage that was taken out on this home.
Original Mortgage
$106,200
Interest Rate
6.53%
Purchase Details
Closed on
Jun 29, 2001
Sold by
Romanelli Pamela A
Bought by
Lopez Victor M and Sanchez Tara S
Home Financials for this Owner
Home Financials are based on the most recent Mortgage that was taken out on this home.
Original Mortgage
$74,333
Interest Rate
7.2%
Mortgage Type
FHA
Create a Home Valuation Report for This Property
The Home Valuation Report is an in-depth analysis detailing your home's value as well as a comparison with similar homes in the area
Home Values in the Area
Average Home Value in this Area
Purchase History
| Date | Buyer | Sale Price | Title Company |
|---|---|---|---|
| Beldan Laurentiu | $144,000 | -- | |
| Wheeler Lenore | $118,000 | -- | |
| Lopez Victor M | $75,500 | -- |
Source: Public Records
Mortgage History
| Date | Status | Borrower | Loan Amount |
|---|---|---|---|
| Open | Beldan Laurentiu | $120,000 | |
| Previous Owner | Wheeler Lenore | $106,200 | |
| Previous Owner | Lopez Victor M | $74,333 |
Source: Public Records
Tax History Compared to Growth
Tax History
| Year | Tax Paid | Tax Assessment Tax Assessment Total Assessment is a certain percentage of the fair market value that is determined by local assessors to be the total taxable value of land and additions on the property. | Land | Improvement |
|---|---|---|---|---|
| 2025 | $5,469 | $110,600 | $35,000 | $75,600 |
| 2024 | $5,499 | $110,600 | $35,000 | $75,600 |
| 2023 | $5,499 | $110,600 | $35,000 | $75,600 |
| 2022 | $5,494 | $110,600 | $35,000 | $75,600 |
| 2021 | $5,645 | $110,600 | $35,000 | $75,600 |
| 2020 | $5,612 | $110,600 | $35,000 | $75,600 |
| 2019 | $5,662 | $110,600 | $35,000 | $75,600 |
| 2018 | $5,647 | $110,600 | $35,000 | $75,600 |
| 2017 | $4,735 | $110,600 | $35,000 | $75,600 |
| 2016 | $4,629 | $110,600 | $35,000 | $75,600 |
| 2015 | $4,434 | $110,600 | $35,000 | $75,600 |
| 2014 | $4,241 | $110,600 | $35,000 | $75,600 |
Source: Public Records
Map
Nearby Homes