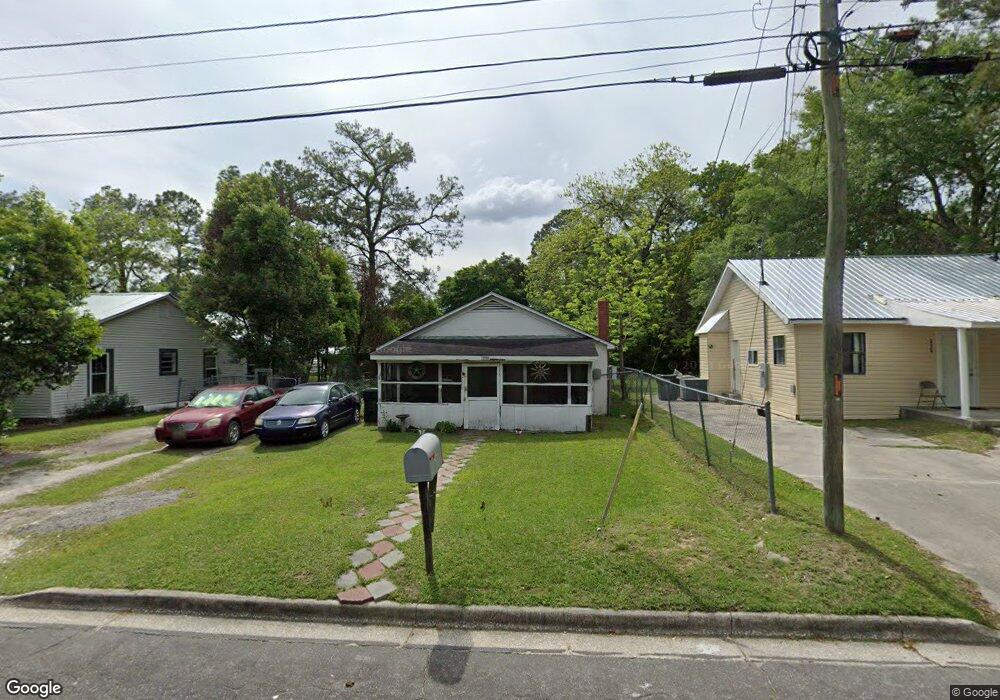
316 9th St SW Moultrie, GA 31768
Estimated Value: $65,057 - $97,000
4
Beds
2
Baths
1,050
Sq Ft
$79/Sq Ft
Est. Value
About This Home
This home is located at 316 9th St SW, Moultrie, GA 31768 and is currently estimated at $83,264, approximately $79 per square foot. 316 9th St SW is a home located in Colquitt County with nearby schools including Stringfellow Elementary School, Willie J. Williams Middle School, and C.A. Gray Junior High School.
Ownership History
Date
Name
Owned For
Owner Type
Purchase Details
Closed on
Aug 9, 2011
Sold by
Secretary Of Housing & Urban Development
Bought by
Mccorvey Randy
Current Estimated Value
Home Financials for this Owner
Home Financials are based on the most recent Mortgage that was taken out on this home.
Original Mortgage
$15,162
Interest Rate
4.54%
Mortgage Type
Purchase Money Mortgage
Purchase Details
Closed on
Nov 2, 2010
Sold by
Turner Glenda
Bought by
Chase Home Finance Llc
Purchase Details
Closed on
Oct 2, 2008
Sold by
Simmons Emily Jackson
Bought by
Turner Glenda and Turner Walker Sabrina
Home Financials for this Owner
Home Financials are based on the most recent Mortgage that was taken out on this home.
Original Mortgage
$34,326
Interest Rate
6.34%
Mortgage Type
FHA
Purchase Details
Closed on
May 1, 2007
Sold by
Johnson George L
Bought by
Simmons Emily Jackson
Purchase Details
Closed on
Aug 16, 2004
Sold by
Keigans J E
Bought by
Johnson George L
Create a Home Valuation Report for This Property
The Home Valuation Report is an in-depth analysis detailing your home's value as well as a comparison with similar homes in the area
Home Values in the Area
Average Home Value in this Area
Purchase History
| Date | Buyer | Sale Price | Title Company |
|---|---|---|---|
| Mccorvey Randy | $8,000 | -- | |
| Chase Home Finance Llc | -- | -- | |
| Secretary Of Housing & Urban Development | $34,118 | -- | |
| Chase Home Finance Llc | $40,343 | -- | |
| Turner Glenda | $34,164 | -- | |
| Simmons Emily Jackson | $17,001 | -- | |
| Johnson George L | $15,000 | -- |
Source: Public Records
Mortgage History
| Date | Status | Borrower | Loan Amount |
|---|---|---|---|
| Closed | Mccorvey Randy | $15,162 | |
| Previous Owner | Turner Glenda | $34,326 |
Source: Public Records
Tax History Compared to Growth
Tax History
| Year | Tax Paid | Tax Assessment Tax Assessment Total Assessment is a certain percentage of the fair market value that is determined by local assessors to be the total taxable value of land and additions on the property. | Land | Improvement |
|---|---|---|---|---|
| 2024 | $453 | $12,371 | $700 | $11,671 |
| 2023 | $373 | $9,082 | $700 | $8,382 |
| 2022 | $292 | $8,726 | $700 | $8,026 |
| 2021 | $264 | $7,793 | $700 | $7,093 |
| 2020 | $269 | $7,793 | $700 | $7,093 |
| 2019 | $303 | $7,793 | $700 | $7,093 |
| 2018 | $311 | $7,793 | $700 | $7,093 |
| 2017 | $299 | $7,793 | $700 | $7,093 |
| 2016 | $311 | $7,793 | $700 | $7,093 |
| 2015 | $312 | $7,793 | $700 | $7,093 |
| 2014 | $320 | $7,793 | $700 | $7,093 |
| 2013 | -- | $7,792 | $700 | $7,092 |
Source: Public Records
Map
Nearby Homes
- 908 3rd Ave SW
- 515 8th St SW
- 610 4th Ave SW
- 618 2nd Ave SW
- 221 6th St SW
- 518 1st Ave SW Unit 3
- 00 1st Ave SW
- 610 1st Ave NW
- 310 1st Ave SW
- 704 3rd St SW
- 614 2nd Ave NW
- 209 7th Ave SW
- 2010 West Blvd
- 408 9th St NW
- 104 Belt Ln
- 1321 Hallmark Dr
- 600 1st St SE
- 521 5th Ave NW
- 40 SE Packer Pride Dr Unit 135
- 40 SE Packer Pride Dr