Estimated Value: $59,000 - $83,000
2
Beds
1
Bath
1,076
Sq Ft
$63/Sq Ft
Est. Value
About This Home
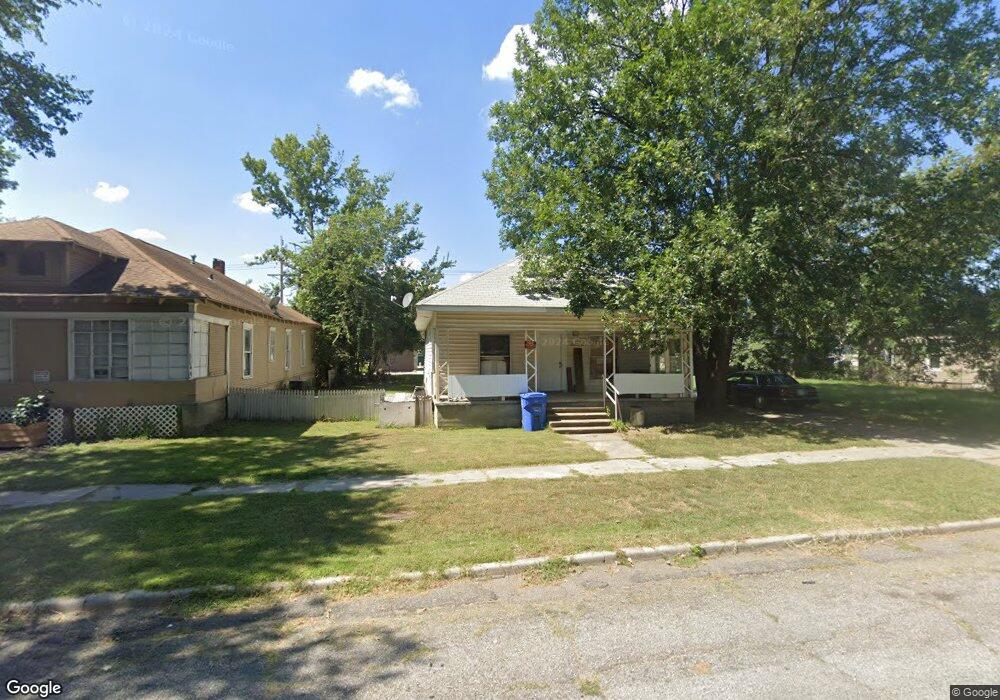
This home is located at 316 A St SW, Miami, OK 74354 and is currently estimated at $68,302, approximately $63 per square foot. 316 A St SW is a home located in Ottawa County with nearby schools including Miami High School and Mt. Olive Lutheran School.
Ownership History
Date
Name
Owned For
Owner Type
Purchase Details
Closed on
Mar 13, 2024
Sold by
Neoki Properties Lc
Bought by
Hopper Bobby and Brenda Cochanouer
Current Estimated Value
Purchase Details
Closed on
Jun 2, 2010
Sold by
Secretary Ofhud Ofwashington Dc
Bought by
Hall Donald
Purchase Details
Closed on
Nov 3, 2005
Sold by
Rhodes Milford A and Rhodes Sandra L
Bought by
Bohannon John E
Home Financials for this Owner
Home Financials are based on the most recent Mortgage that was taken out on this home.
Original Mortgage
$34,353
Interest Rate
5.92%
Mortgage Type
FHA
Purchase Details
Closed on
Jun 12, 2002
Bought by
Rhodes Milford and Rhodes Sandra
Purchase Details
Closed on
May 17, 1999
Bought by
Hipkins Elsie
Purchase Details
Closed on
Oct 23, 1998
Bought by
Perry Norma
Purchase Details
Closed on
Nov 10, 1997
Bought by
Perry Richard and Perry John
Purchase Details
Closed on
Apr 3, 1997
Bought by
Perry Norma
Create a Home Valuation Report for This Property
The Home Valuation Report is an in-depth analysis detailing your home's value as well as a comparison with similar homes in the area
Purchase History
| Date | Buyer | Sale Price | Title Company |
|---|---|---|---|
| Hopper Bobby | -- | None Listed On Document | |
| Hall Donald | -- | None Available | |
| Bohannon John E | $34,500 | None Available | |
| Rhodes Milford | $23,000 | -- | |
| Hipkins Elsie | $16,000 | -- | |
| Perry Norma | -- | -- | |
| Perry Richard | -- | -- | |
| Perry Norma | -- | -- |
Source: Public Records
Mortgage History
| Date | Status | Borrower | Loan Amount |
|---|---|---|---|
| Previous Owner | Bohannon John E | $34,353 |
Source: Public Records
Tax History
| Year | Tax Paid | Tax Assessment Tax Assessment Total Assessment is a certain percentage of the fair market value that is determined by local assessors to be the total taxable value of land and additions on the property. | Land | Improvement |
|---|---|---|---|---|
| 2025 | $433 | $4,501 | $456 | $4,045 |
| 2024 | $472 | $4,896 | $456 | $4,440 |
| 2023 | $472 | $5,393 | $456 | $4,937 |
| 2022 | $482 | $5,210 | $456 | $4,754 |
| 2021 | $469 | $4,962 | $456 | $4,506 |
| 2020 | $450 | $4,726 | $456 | $4,270 |
| 2019 | $409 | $4,983 | $456 | $4,527 |
| 2018 | $412 | $4,983 | $456 | $4,527 |
| 2017 | $419 | $4,983 | $456 | $4,527 |
| 2016 | $414 | $5,148 | $456 | $4,692 |
| 2015 | $349 | $3,933 | $310 | $3,623 |
| 2014 | $344 | $4,204 | $456 | $3,748 |
Source: Public Records
Map
Nearby Homes
Your Personal Tour Guide
Ask me questions while you tour the home.