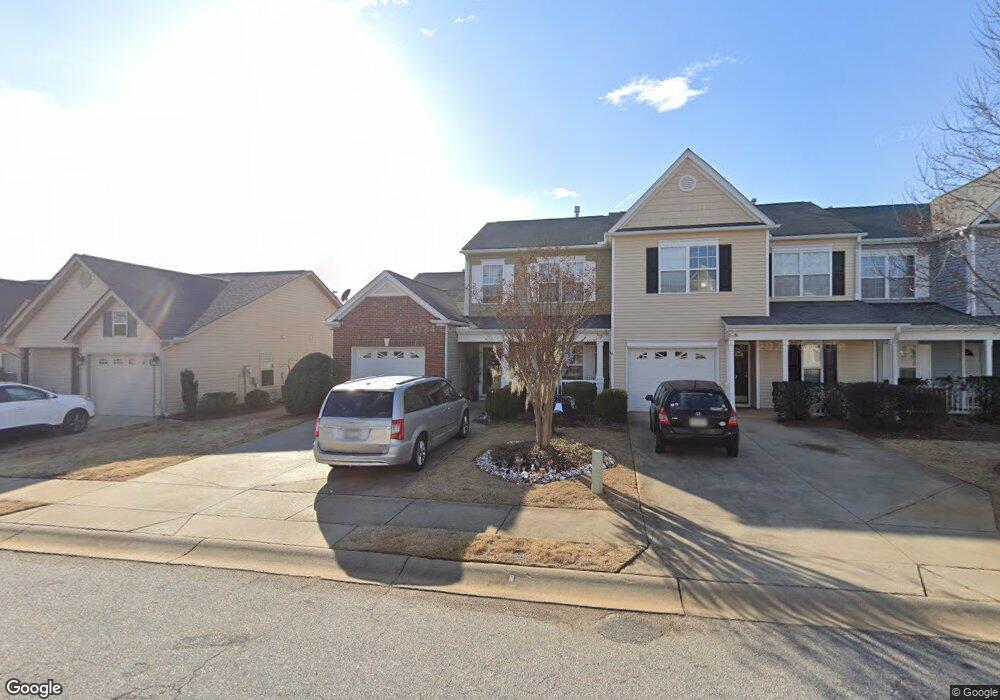
316 Aniken Cir Boiling Springs, SC 29316
Estimated Value: $206,898 - $228,000
3
Beds
3
Baths
1,389
Sq Ft
$155/Sq Ft
Est. Value
About This Home
This home is located at 316 Aniken Cir, Boiling Springs, SC 29316 and is currently estimated at $215,975, approximately $155 per square foot. 316 Aniken Cir is a home located in Spartanburg County with nearby schools including Shoally Creek Elementary School, Rainbow Lake Middle School, and Boiling Springs High School.
Ownership History
Date
Name
Owned For
Owner Type
Purchase Details
Closed on
Feb 27, 2015
Sold by
King Rosemarie L
Bought by
Cantrell Virginia
Current Estimated Value
Home Financials for this Owner
Home Financials are based on the most recent Mortgage that was taken out on this home.
Original Mortgage
$96,000
Outstanding Balance
$73,556
Interest Rate
3.77%
Mortgage Type
Future Advance Clause Open End Mortgage
Estimated Equity
$142,419
Purchase Details
Closed on
Nov 12, 2010
Sold by
Mark Iii Properties Inc
Bought by
King Rosemarie L
Home Financials for this Owner
Home Financials are based on the most recent Mortgage that was taken out on this home.
Original Mortgage
$103,799
Interest Rate
4.25%
Mortgage Type
FHA
Purchase Details
Closed on
May 18, 2009
Sold by
Poinsett Homes Llc
Bought by
Mark Iii Properties Inc
Create a Home Valuation Report for This Property
The Home Valuation Report is an in-depth analysis detailing your home's value as well as a comparison with similar homes in the area
Home Values in the Area
Average Home Value in this Area
Purchase History
| Date | Buyer | Sale Price | Title Company |
|---|---|---|---|
| Cantrell Virginia | $120,000 | -- | |
| King Rosemarie L | $106,500 | -- | |
| Mark Iii Properties Inc | $2,014,500 | -- |
Source: Public Records
Mortgage History
| Date | Status | Borrower | Loan Amount |
|---|---|---|---|
| Open | Cantrell Virginia | $96,000 | |
| Previous Owner | King Rosemarie L | $103,799 |
Source: Public Records
Tax History Compared to Growth
Tax History
| Year | Tax Paid | Tax Assessment Tax Assessment Total Assessment is a certain percentage of the fair market value that is determined by local assessors to be the total taxable value of land and additions on the property. | Land | Improvement |
|---|---|---|---|---|
| 2025 | $1,025 | $5,925 | $1,390 | $4,535 |
| 2024 | $1,025 | $5,925 | $1,390 | $4,535 |
| 2023 | $1,025 | $5,925 | $1,390 | $4,535 |
| 2022 | $912 | $5,152 | $1,100 | $4,052 |
| 2021 | $910 | $5,152 | $1,100 | $4,052 |
| 2020 | $895 | $5,152 | $1,100 | $4,052 |
| 2019 | $895 | $5,152 | $1,100 | $4,052 |
| 2018 | $875 | $5,152 | $1,100 | $4,052 |
| 2017 | $823 | $4,800 | $1,100 | $3,700 |
| 2016 | $828 | $4,796 | $1,100 | $3,696 |
| 2015 | $793 | $4,604 | $1,100 | $3,504 |
| 2014 | $781 | $4,604 | $1,100 | $3,504 |
Source: Public Records
Map
Nearby Homes
- 517 Tilgate Ct
- 652 Clarion Ct
- 775 Overton Ridge Way
- 234 Ferndale Dr
- 5082 Sunnycreek Dr
- 5085 Sunnycreek Dr
- 5086 Sunnycreek Dr
- 5090 Sunnycreek Dr
- 5077 Sunnycreek Dr
- 5081 Sunnycreek Dr
- 125 Condor Place
- 423 Shoally Rd
- 864 Thornbird Cir
- Crestfall II Plan at Hazelwood
- Glenwood II Plan at Hazelwood
- Laurel II Plan at Hazelwood
- Bentcreek II Plan at Hazelwood
- Hidden Creek II Plan at Hazelwood
- 133 Valley Creek Dr
- 125 Shoally St
- 312 Aniken Cir
- 320 Aniken Cir
- 308 Aniken Cir
- 304 Aniken Cir
- 328 Aniken Cir
- 406 Aniken Cir
- 414 Aniken Cir
- 332 Aniken Cir
- 315 Aniken Cir
- 307 Aniken Cir
- 402 Aniken Cir
- 418 Aniken Cir
- 323 Aniken Cir
- 303 Aniken Cir
- 327 Aniken Cir
- 336 Aniken Cir
- 398 Aniken Cir
- 331 Aniken Cir
- 205 Stinson Ct
- 135 Wynbrook Way