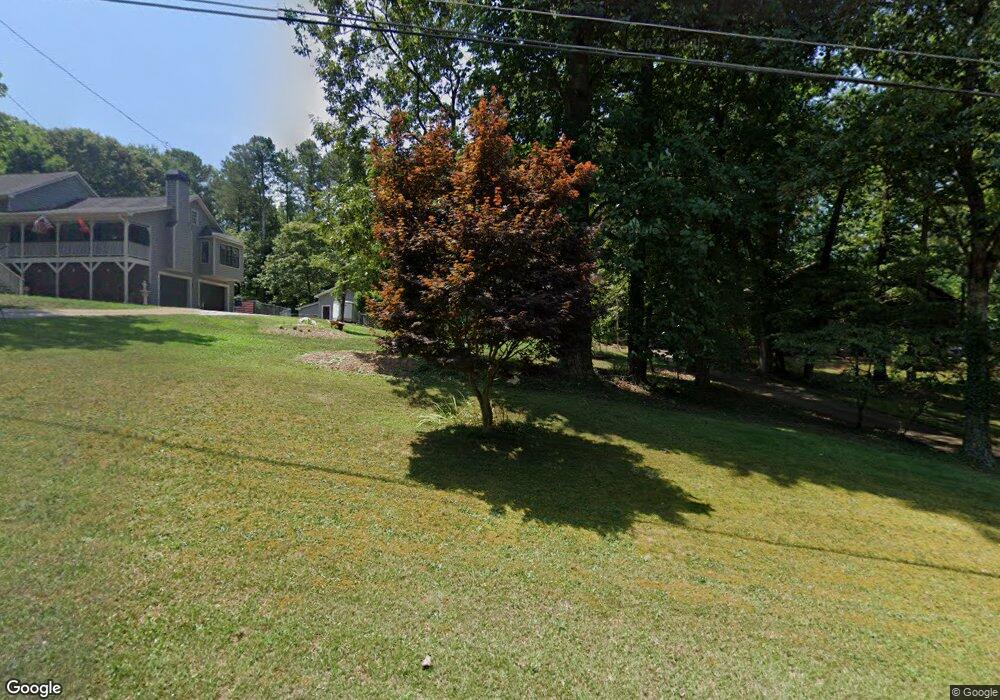
316 Bethel Dr Unit 1 Woodstock, GA 30189
Sutallee NeighborhoodEstimated Value: $394,000 - $450,712
4
Beds
3
Baths
2,304
Sq Ft
$183/Sq Ft
Est. Value
About This Home
This home is located at 316 Bethel Dr Unit 1, Woodstock, GA 30189 and is currently estimated at $422,356, approximately $183 per square foot. 316 Bethel Dr Unit 1 is a home located in Cherokee County with nearby schools including Boston Elementary School, E. T. Booth Middle School, and Etowah High School.
Ownership History
Date
Name
Owned For
Owner Type
Purchase Details
Closed on
Jul 29, 2021
Sold by
Shiver Foy
Bought by
Shiver Donna
Current Estimated Value
Home Financials for this Owner
Home Financials are based on the most recent Mortgage that was taken out on this home.
Original Mortgage
$228,000
Outstanding Balance
$207,323
Interest Rate
2.9%
Mortgage Type
New Conventional
Estimated Equity
$215,033
Purchase Details
Closed on
Apr 28, 2000
Sold by
Reeves Dennis D
Bought by
Shiver Foy and Shiver Donna
Home Financials for this Owner
Home Financials are based on the most recent Mortgage that was taken out on this home.
Original Mortgage
$124,300
Interest Rate
8.23%
Mortgage Type
New Conventional
Purchase Details
Closed on
May 26, 1993
Sold by
Knox Dennis M and Knox Debra
Bought by
Reeves Dennis D
Home Financials for this Owner
Home Financials are based on the most recent Mortgage that was taken out on this home.
Original Mortgage
$103,500
Interest Rate
7.44%
Create a Home Valuation Report for This Property
The Home Valuation Report is an in-depth analysis detailing your home's value as well as a comparison with similar homes in the area
Home Values in the Area
Average Home Value in this Area
Purchase History
| Date | Buyer | Sale Price | Title Company |
|---|---|---|---|
| Shiver Donna | -- | -- | |
| Shiver Foy | $148,000 | -- | |
| Reeves Dennis D | $115,000 | -- |
Source: Public Records
Mortgage History
| Date | Status | Borrower | Loan Amount |
|---|---|---|---|
| Open | Shiver Donna | $228,000 | |
| Previous Owner | Shiver Foy | $124,300 | |
| Previous Owner | Reeves Dennis D | $103,500 |
Source: Public Records
Tax History Compared to Growth
Tax History
| Year | Tax Paid | Tax Assessment Tax Assessment Total Assessment is a certain percentage of the fair market value that is determined by local assessors to be the total taxable value of land and additions on the property. | Land | Improvement |
|---|---|---|---|---|
| 2024 | $3,890 | $149,708 | $33,200 | $116,508 |
| 2023 | $3,850 | $148,148 | $29,200 | $118,948 |
| 2022 | $3,237 | $123,148 | $26,000 | $97,148 |
| 2021 | $2,827 | $99,588 | $19,920 | $79,668 |
| 2020 | $2,564 | $90,228 | $17,800 | $72,428 |
| 2019 | $2,189 | $77,040 | $15,400 | $61,640 |
| 2018 | $2,093 | $73,200 | $14,000 | $59,200 |
| 2017 | $1,863 | $176,900 | $14,000 | $56,760 |
| 2016 | $1,863 | $160,000 | $12,000 | $52,000 |
| 2015 | $1,671 | $142,100 | $11,400 | $45,440 |
| 2014 | $1,561 | $132,500 | $11,400 | $41,600 |
Source: Public Records
Map
Nearby Homes
- 314 Bethel Dr
- 819 Victoria Place
- 619 Lovinggood Trail
- 504 N Little Victoria Rd
- 418 Allatoona Trail
- 477 Victoria Rd
- 617 Driftwood Dr
- 609 Redwood Dr
- 313 Maltibe Dr
- 923 Pine Cir
- 308 Mainsail Ln
- 306 N Briar Ridge
- 0 Black Oak Trail Unit 10267626
- 0 Black Oak Trail Unit 7303191
- 401 Cottonwood Dr
- 146 Sunset Ln
- 137 Dockside Downs Dr
- 7119 Big Woods Dr
- 507 Huntgate Rd
- 318 Bethel Dr
- 0 Bethel Dr Unit 3191897
- 0 Bethel Dr Unit 3128607
- 0 Bethel Dr Unit 8818526
- 0 Bethel Dr Unit 8501773
- 0 Bethel Dr Unit 8385056
- 0 Bethel Dr Unit 8098750
- 0 Bethel Dr Unit 8089008
- 320 Bethel Dr
- 312 Bethel Dr Unit 1
- 317 Bethel Dr
- 315 Bethel Dr
- 319 Bethel Dr Unit I
- 313 Bethel Dr Unit 1
- 322 Bethel Dr
- 310 Bethel Dr
- 311 Bethel Dr
- 321 Bethel Dr
- 914 Victoria Landing Dr Unit 914
- 914 Victoria Landing Dr