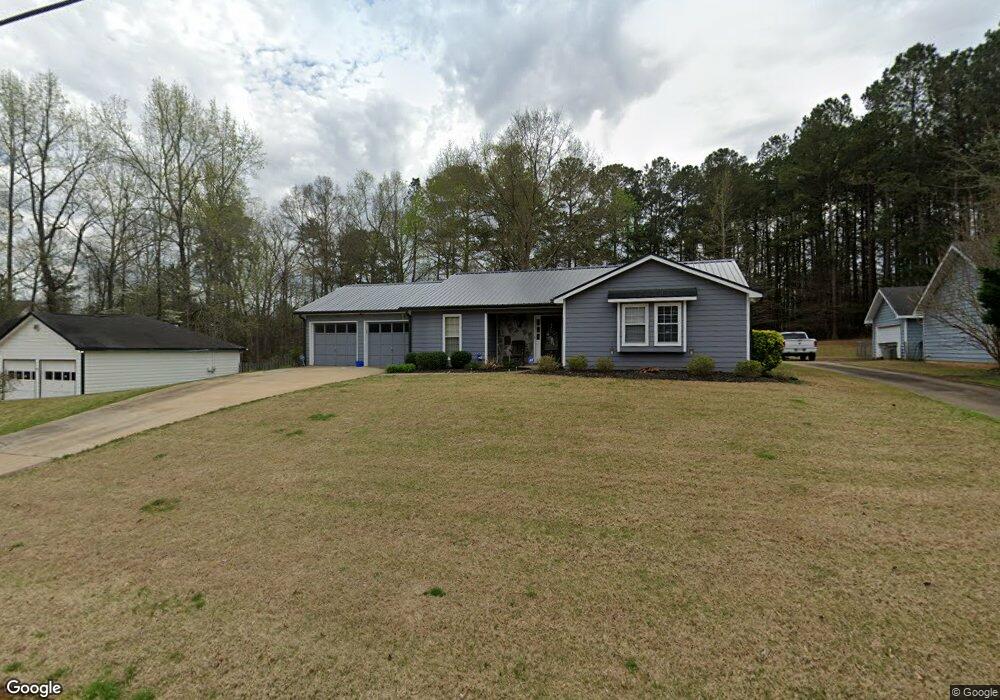
316 Brookstone Dr Lagrange, GA 30241
Estimated Value: $225,000 - $240,000
3
Beds
2
Baths
1,792
Sq Ft
$129/Sq Ft
Est. Value
About This Home
This home is located at 316 Brookstone Dr, Lagrange, GA 30241 and is currently estimated at $231,494, approximately $129 per square foot. 316 Brookstone Dr is a home located in Troup County with nearby schools including Callaway Elementary School, Hogansville Elementary School, and Callaway Middle School.
Ownership History
Date
Name
Owned For
Owner Type
Purchase Details
Closed on
Apr 24, 2003
Sold by
Stacey C Brown Interest
Bought by
Brown Stacey C and Brown Janice
Current Estimated Value
Purchase Details
Closed on
Apr 23, 2003
Sold by
Janice Brown
Bought by
Stacey C Brown Interest
Purchase Details
Closed on
Aug 2, 2001
Sold by
Stacey C Brown
Bought by
Janice Brown
Purchase Details
Closed on
Aug 1, 2001
Sold by
Carole Trawick
Bought by
Stacey C Brown
Purchase Details
Closed on
Jan 31, 1994
Sold by
Hammock Randall F
Bought by
Carole Trawick
Purchase Details
Closed on
Apr 4, 1991
Sold by
Jerry C Averett
Bought by
Hammock Randall F
Purchase Details
Closed on
Jul 12, 1990
Sold by
Jim B Wiles
Bought by
Jerry C Averett
Purchase Details
Closed on
Oct 1, 1986
Bought by
Jim B Wiles
Create a Home Valuation Report for This Property
The Home Valuation Report is an in-depth analysis detailing your home's value as well as a comparison with similar homes in the area
Purchase History
| Date | Buyer | Sale Price | Title Company |
|---|---|---|---|
| Brown Stacey C | -- | -- | |
| Stacey C Brown Interest | -- | -- | |
| Janice Brown | -- | -- | |
| Stacey C Brown | $113,500 | -- | |
| Carole Trawick | $84,000 | -- | |
| Hammock Randall F | $82,800 | -- | |
| Jerry C Averett | $10,700 | -- | |
| Jim B Wiles | -- | -- |
Source: Public Records
Tax History
| Year | Tax Paid | Tax Assessment Tax Assessment Total Assessment is a certain percentage of the fair market value that is determined by local assessors to be the total taxable value of land and additions on the property. | Land | Improvement |
|---|---|---|---|---|
| 2025 | $2,324 | $93,000 | $14,000 | $79,000 |
| 2024 | $2,036 | $76,640 | $14,000 | $62,640 |
| 2023 | $2,119 | $79,680 | $14,000 | $65,680 |
| 2022 | $1,801 | $66,520 | $10,000 | $56,520 |
| 2021 | $1,658 | $56,960 | $8,000 | $48,960 |
| 2020 | $1,658 | $56,960 | $8,000 | $48,960 |
| 2019 | $1,384 | $47,880 | $8,000 | $39,880 |
| 2018 | $1,198 | $41,720 | $6,000 | $35,720 |
| 2017 | $1,198 | $41,720 | $6,000 | $35,720 |
| 2016 | $1,198 | $41,705 | $6,000 | $35,705 |
| 2015 | $1,200 | $41,705 | $6,000 | $35,705 |
| 2014 | $1,145 | $39,826 | $6,000 | $33,826 |
| 2013 | -- | $38,975 | $6,000 | $32,975 |
Source: Public Records
Map
Nearby Homes
- 105 Ridgefield Dr
- 509 Youngs Mill Rd
- 101 Sarah Ln
- 124 Woodridge Cir
- 109 Sarah Ln
- 793 Celebration Blvd
- 227 River Meadow Dr
- 412 Sweetwood Ct Unit A36
- 304 Bridgette Blvd
- 107 N Barnard Ave
- 112 Celebration Blvd
- 0 N Barnard Ave
- 110 Lenox Cir
- 300 Old Pond Rd
- 115 Clara Jean Ct
- 129 Celebration Blvd
- 119 Sir Lancelot St
- 210 Hearthstone Dr
- 517 Tradition Place
- 212 Cleveland Dr
- 214 Brookstone Dr
- 318 Brookstone Dr
- 200 Brookcrest Dr
- 212 Brookstone Dr
- 320 Brookstone Dr
- 201 Brookcrest Dr
- 210 Brookstone Dr
- 209 Baileys Way
- 209 Baileys Way Unit LOT 72
- 322 Brookstone Dr
- 202 Brookcrest Dr
- 211 Baileys Way
- 203 Brookcrest Dr
- 209 Brookstone Dr
- 301 Brookfield Dr
- 324 Brookstone Dr
- 208 Brookstone Dr
- 205 Baileys Way
- 204 Brookcrest Dr
- 0 Baileys Point Unit 7320307
Your Personal Tour Guide
Ask me questions while you tour the home.