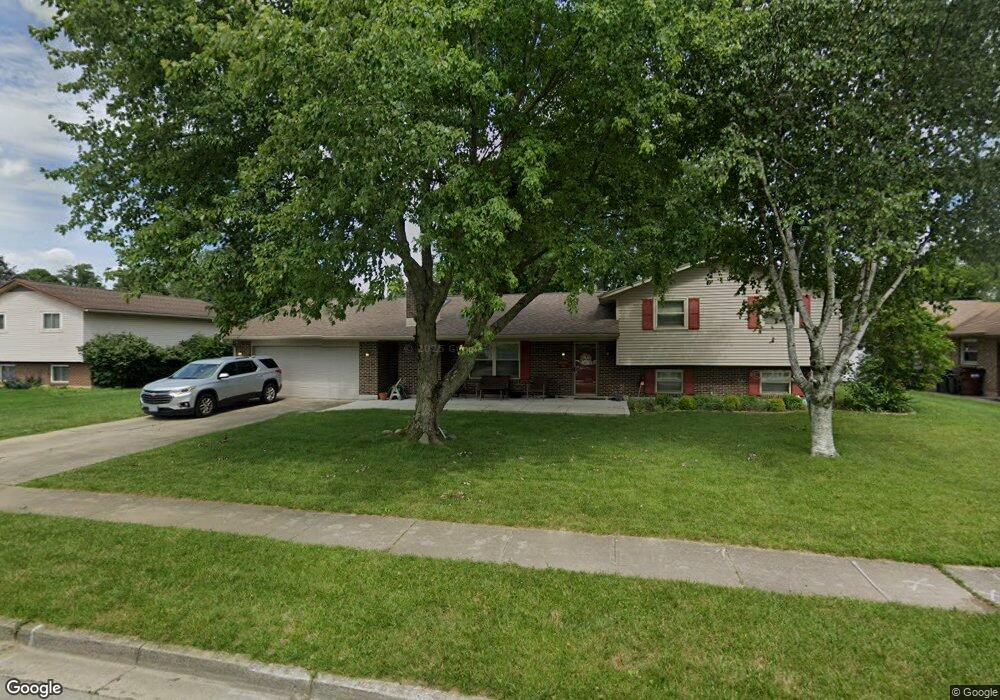
316 Chris Dr Englewood, OH 45322
Estimated Value: $289,000 - $330,782
4
Beds
3
Baths
2,667
Sq Ft
$115/Sq Ft
Est. Value
About This Home
This home is located at 316 Chris Dr, Englewood, OH 45322 and is currently estimated at $307,446, approximately $115 per square foot. 316 Chris Dr is a home located in Montgomery County with nearby schools including Northmont High School and Salem Christian Academy.
Ownership History
Date
Name
Owned For
Owner Type
Purchase Details
Closed on
Jul 24, 2017
Sold by
Romanak Mary E
Bought by
Larue A Ja D
Current Estimated Value
Home Financials for this Owner
Home Financials are based on the most recent Mortgage that was taken out on this home.
Original Mortgage
$157,102
Outstanding Balance
$131,342
Interest Rate
4.12%
Mortgage Type
FHA
Estimated Equity
$176,104
Purchase Details
Closed on
Sep 17, 2007
Sold by
Romanak Mary E
Bought by
Romanak Mary E
Purchase Details
Closed on
Sep 4, 2007
Sold by
Estate Of Mark S Romanak
Bought by
Romanak Mary E and The Mark S Romanak Revocable Living Tr
Purchase Details
Closed on
Dec 3, 1999
Sold by
Romanak Karen E
Bought by
Romanak Mark S
Home Financials for this Owner
Home Financials are based on the most recent Mortgage that was taken out on this home.
Original Mortgage
$116,250
Interest Rate
8.02%
Purchase Details
Closed on
Oct 15, 1998
Sold by
Lammert Devries Jan
Bought by
Romanak Mark S and Romanak Karen E
Home Financials for this Owner
Home Financials are based on the most recent Mortgage that was taken out on this home.
Original Mortgage
$65,000
Interest Rate
6.9%
Create a Home Valuation Report for This Property
The Home Valuation Report is an in-depth analysis detailing your home's value as well as a comparison with similar homes in the area
Home Values in the Area
Average Home Value in this Area
Purchase History
| Date | Buyer | Sale Price | Title Company |
|---|---|---|---|
| Larue A Ja D | $160,000 | Landmark Title Agency South | |
| Romanak Mary E | -- | Attorney | |
| Romanak Mary E | -- | None Available | |
| Romanak Mark S | -- | Landmark Title Agency Inc | |
| Romanak Mark S | $155,000 | Landmark Title Agency Inc | |
| Romanak Mark S | $155,000 | Landmark Title |
Source: Public Records
Mortgage History
| Date | Status | Borrower | Loan Amount |
|---|---|---|---|
| Open | Larue A Ja D | $157,102 | |
| Previous Owner | Romanak Mark S | $116,250 | |
| Previous Owner | Romanak Mark S | $65,000 |
Source: Public Records
Tax History Compared to Growth
Tax History
| Year | Tax Paid | Tax Assessment Tax Assessment Total Assessment is a certain percentage of the fair market value that is determined by local assessors to be the total taxable value of land and additions on the property. | Land | Improvement |
|---|---|---|---|---|
| 2024 | $5,173 | $90,900 | $13,020 | $77,880 |
| 2023 | $5,173 | $90,900 | $13,020 | $77,880 |
| 2022 | $4,149 | $56,080 | $8,040 | $48,040 |
| 2021 | $4,161 | $56,080 | $8,040 | $48,040 |
| 2020 | $4,086 | $56,080 | $8,040 | $48,040 |
| 2019 | $4,018 | $49,470 | $8,040 | $41,430 |
| 2018 | $3,945 | $49,470 | $8,040 | $41,430 |
| 2017 | $3,918 | $49,470 | $8,040 | $41,430 |
| 2016 | $3,718 | $46,120 | $8,040 | $38,080 |
| 2015 | $3,399 | $46,120 | $8,040 | $38,080 |
| 2014 | $3,399 | $46,120 | $8,040 | $38,080 |
| 2012 | -- | $50,910 | $8,980 | $41,930 |
Source: Public Records
Map
Nearby Homes
- 408 W Herr St
- 604 Heather St
- 322 Rankin Dr
- 321 Rankin Dr
- 332 Beckenham Rd
- 320 Camborne Dr
- 308 Magnolia Ave
- 118 Elm Ct
- 4005 Clearstream Way
- 430 N Main St
- 128 Union Ridge Dr
- 123 Chestnut St
- 63 Sweet Potato Ridge Rd
- 106 Warner Dr
- 402 Bramlage Ln
- 208 S Walnut St
- 200 Sheets St
- 2004 Clearstream Way
- 600 W Martindale Rd
- 607 Albert St
- 314 Chris Dr
- 320 Chris Dr
- 309 Downing Place
- 307 Downing Place
- 317 Chris Dr
- 312 Chris Dr
- 315 Chris Dr
- 319 Chris Dr
- 305 Downing Place
- 313 Chris Dr
- 519 Berkshire Cir
- 404 Beechgrove Dr
- 316 Scott Dr
- 303 Downing Place
- 327 Beechgrove Dr
- 314 Scott Dr
- 407 Beechgrove Dr
- 402 Beechgrove Dr
- 309 Chris Dr
- 401 Chris Dr