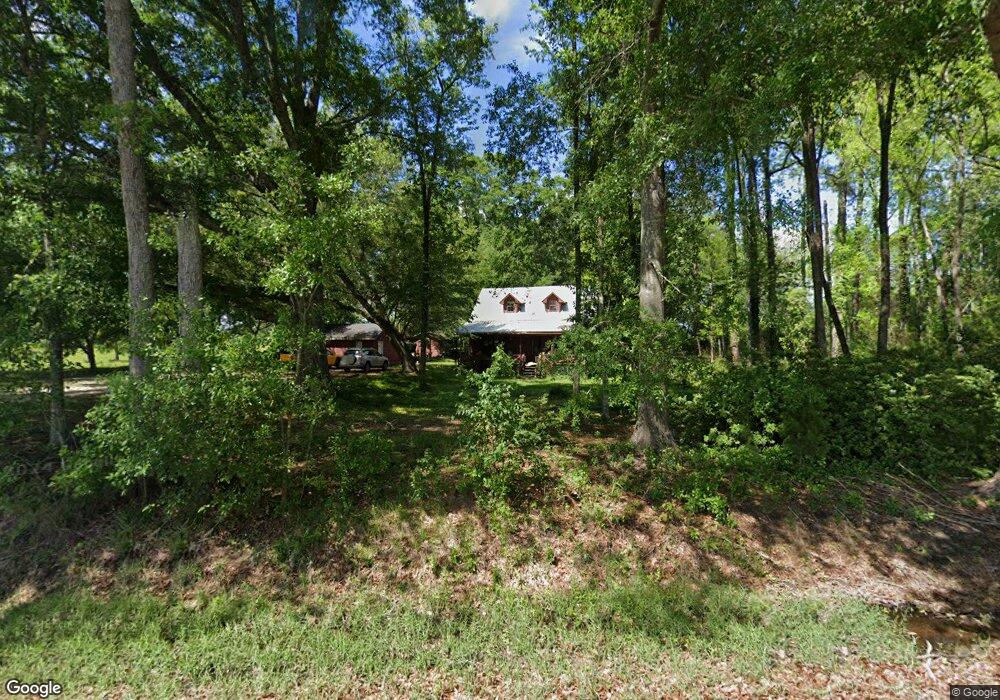
316 Clarence Jones Rd Moultrie, GA 31768
Estimated Value: $171,260 - $194,000
--
Bed
2
Baths
1,440
Sq Ft
$127/Sq Ft
Est. Value
About This Home
This home is located at 316 Clarence Jones Rd, Moultrie, GA 31768 and is currently estimated at $183,315, approximately $127 per square foot. 316 Clarence Jones Rd is a home located in Colquitt County with nearby schools including Okapilco Elementary School, C.A. Gray Junior High School, and Willie J. Williams Middle School.
Ownership History
Date
Name
Owned For
Owner Type
Purchase Details
Closed on
Oct 19, 2017
Sold by
Erskine Sandra H
Bought by
Tyson Stephen David Scott
Current Estimated Value
Home Financials for this Owner
Home Financials are based on the most recent Mortgage that was taken out on this home.
Original Mortgage
$79,227
Outstanding Balance
$66,925
Interest Rate
4.25%
Mortgage Type
FHA
Estimated Equity
$116,390
Purchase Details
Closed on
Mar 15, 2016
Sold by
Stanford Joseph D
Bought by
Erskine Sandra H and Joshua Erskine V
Home Financials for this Owner
Home Financials are based on the most recent Mortgage that was taken out on this home.
Original Mortgage
$82,776
Interest Rate
3.65%
Mortgage Type
New Conventional
Purchase Details
Closed on
Jun 28, 2002
Sold by
Bullard Benjamin J
Bought by
Stanford Joseph D
Purchase Details
Closed on
Sep 19, 1997
Bought by
Bullard Benjamin J
Create a Home Valuation Report for This Property
The Home Valuation Report is an in-depth analysis detailing your home's value as well as a comparison with similar homes in the area
Home Values in the Area
Average Home Value in this Area
Purchase History
| Date | Buyer | Sale Price | Title Company |
|---|---|---|---|
| Tyson Stephen David Scott | $89,500 | -- | |
| Erskine Sandra H | $80,500 | -- | |
| Stanford Joseph D | $100,800 | -- | |
| Bullard Benjamin J | $68,000 | -- |
Source: Public Records
Mortgage History
| Date | Status | Borrower | Loan Amount |
|---|---|---|---|
| Open | Tyson Stephen David Scott | $79,227 | |
| Previous Owner | Erskine Sandra H | $82,776 |
Source: Public Records
Tax History Compared to Growth
Tax History
| Year | Tax Paid | Tax Assessment Tax Assessment Total Assessment is a certain percentage of the fair market value that is determined by local assessors to be the total taxable value of land and additions on the property. | Land | Improvement |
|---|---|---|---|---|
| 2024 | $1,187 | $61,867 | $4,493 | $57,374 |
| 2023 | $1,262 | $48,999 | $4,493 | $44,506 |
| 2022 | $997 | $43,859 | $3,993 | $39,866 |
| 2021 | $898 | $38,989 | $3,993 | $34,996 |
| 2020 | $851 | $36,443 | $3,993 | $32,450 |
| 2019 | $900 | $34,746 | $3,993 | $30,753 |
| 2018 | $889 | $34,746 | $3,993 | $30,753 |
| 2017 | $822 | $36,902 | $6,149 | $30,753 |
| 2016 | $1,244 | $45,097 | $6,149 | $38,948 |
| 2015 | $1,186 | $44,622 | $6,149 | $38,473 |
| 2014 | $1,164 | $44,622 | $6,149 | $38,473 |
| 2013 | -- | $44,622 | $6,148 | $38,473 |
Source: Public Records
Map
Nearby Homes
- 514 Indian Lake Dr
- 218 Gusty Rd
- 178 Cool Breeze Dr
- 131 Seminole Dr
- 441 Cherokee Dr
- 210 Arrowhead Dr
- 273 Seminole Dr
- 3233 Sylvester Dr
- 209 Cherokee Dr
- 107 30th Ave NW
- 15,23,27 29th Ave NW
- 378 Old S R 33
- 0 S U Highway 319 N
- 102 Schley Church Rd
- 0 Doc Darbyshire Rd
- 1208 Maple St
- 615 1st St NW
- 722 Martin Luther King jr Dr
- LL261 Rowland Dr
- LOT 60 Georgia 37
- 346 Clarence Jones Rd
- 368 Clarence Jones Rd
- 388 Clarence Jones Rd
- 408 Clarence Jones Rd
- 420 Clarence Jones Rd
- 440 Clarence Jones Rd
- 458 Clarence Jones Rd
- 1105 Sumner Rd
- 1131 Sumner Rd
- 1149 Sumner Rd
- 971 Sumner Rd
- 1169 Sumner Rd
- 1092 Sumner Rd
- 1183 Sumner Rd
- 1118 Sumner Rd
- 1195 Sumner Rd
- 1140 Sumner Rd
- 534 Clarence Jones Rd
- 1158 Sumner Rd
- 1205 Sumner Rd