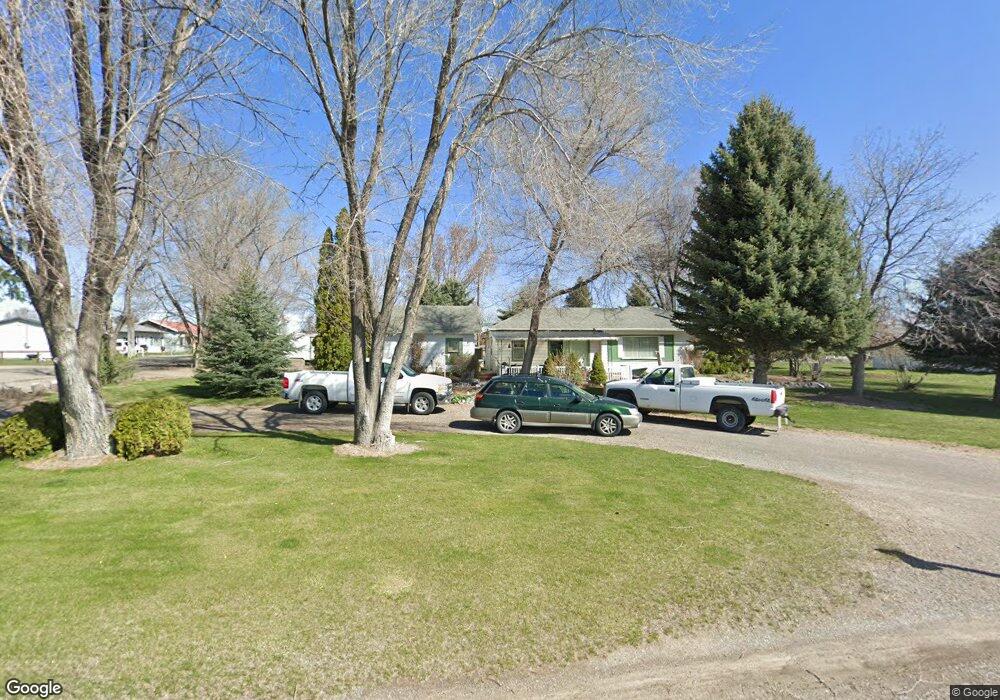
316 Denver St W Murtaugh, ID 83344
Estimated Value: $233,000 - $316,000
2
Beds
1
Bath
1,231
Sq Ft
$229/Sq Ft
Est. Value
About This Home
This home is located at 316 Denver St W, Murtaugh, ID 83344 and is currently estimated at $282,450, approximately $229 per square foot. 316 Denver St W is a home with nearby schools including Murtaugh Schools.
Ownership History
Date
Name
Owned For
Owner Type
Purchase Details
Closed on
Dec 6, 2007
Sold by
Vargas Fernando and Vargas Jessica
Bought by
Hamby Larry G and Hamby Carma L
Current Estimated Value
Home Financials for this Owner
Home Financials are based on the most recent Mortgage that was taken out on this home.
Original Mortgage
$77,000
Outstanding Balance
$47,746
Interest Rate
6.26%
Mortgage Type
New Conventional
Estimated Equity
$234,704
Purchase Details
Closed on
Aug 18, 2005
Sold by
Jensen Jeremy and Jensen Jeremy Michael
Bought by
Option One Mortgage Corp
Purchase Details
Closed on
May 18, 2005
Sold by
Larusso Paul A and Larusso Mary Linda
Bought by
Vargas Fernando and Vargas Jessica
Home Financials for this Owner
Home Financials are based on the most recent Mortgage that was taken out on this home.
Original Mortgage
$75,000
Interest Rate
5.74%
Mortgage Type
Purchase Money Mortgage
Create a Home Valuation Report for This Property
The Home Valuation Report is an in-depth analysis detailing your home's value as well as a comparison with similar homes in the area
Purchase History
| Date | Buyer | Sale Price | Title Company |
|---|---|---|---|
| Hamby Larry G | -- | Alliance Title | |
| Option One Mortgage Corp | $84,500 | -- | |
| Vargas Fernando | -- | -- |
Source: Public Records
Mortgage History
| Date | Status | Borrower | Loan Amount |
|---|---|---|---|
| Open | Hamby Larry G | $77,000 | |
| Previous Owner | Vargas Fernando | $75,000 |
Source: Public Records
Tax History
| Year | Tax Paid | Tax Assessment Tax Assessment Total Assessment is a certain percentage of the fair market value that is determined by local assessors to be the total taxable value of land and additions on the property. | Land | Improvement |
|---|---|---|---|---|
| 2025 | $1,140 | $209,535 | $61,009 | $148,526 |
| 2024 | $1,103 | $211,623 | $61,009 | $150,614 |
| 2023 | $1,219 | $213,820 | $61,009 | $152,811 |
| 2022 | $1,617 | $209,467 | $51,635 | $157,832 |
| 2021 | $1,402 | $148,962 | $22,308 | $126,654 |
| 2020 | $1,294 | $125,539 | $22,308 | $103,231 |
| 2019 | $1,309 | $117,927 | $18,094 | $99,833 |
| 2018 | $1,107 | $113,044 | $12,601 | $100,443 |
| 2017 | $1,041 | $103,393 | $12,601 | $90,792 |
| 2016 | $921 | $89,525 | $0 | $0 |
| 2015 | $919 | $89,525 | $12,601 | $76,924 |
| 2012 | -- | $85,275 | $0 | $0 |
Source: Public Records
Map
Nearby Homes
Your Personal Tour Guide
Ask me questions while you tour the home.