Studio
--
Bath
3,353
Sq Ft
20,038
Sq Ft Lot
About This Home
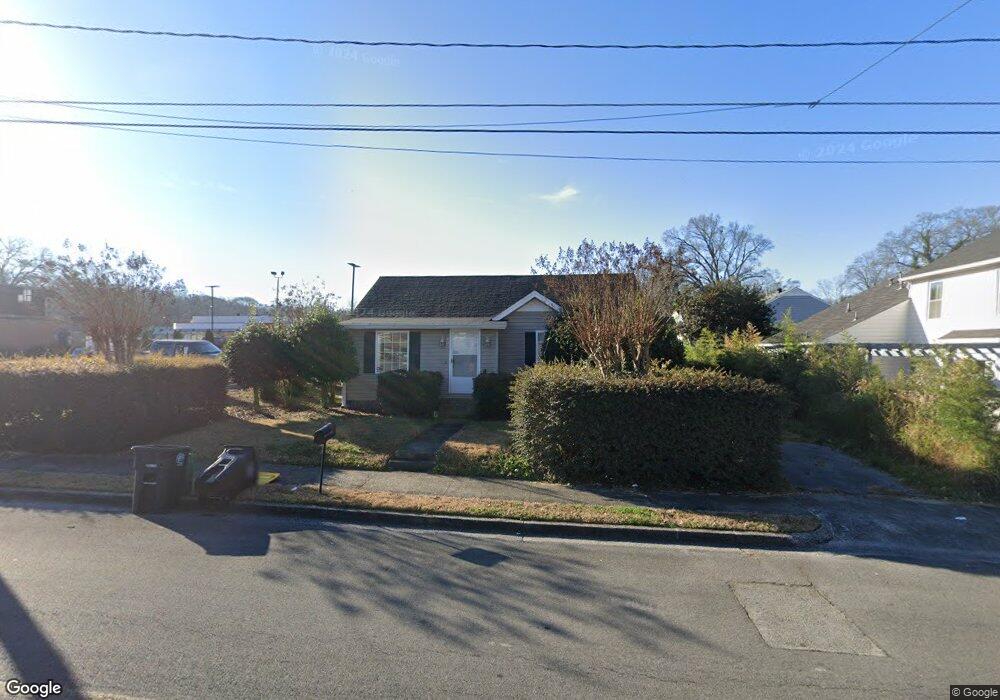
This home is located at 316 E 7th St SW, Rome, GA 30161. 316 E 7th St SW is a home located in Floyd County with nearby schools including Rome High School, St. Mary School, and Darlington School.
Ownership History
Date
Name
Owned For
Owner Type
Purchase Details
Closed on
Aug 27, 2015
Sold by
Heritage First Bank
Bought by
Wrens Nest Properties Llc
Purchase Details
Closed on
Mar 27, 2002
Sold by
Laipple Alison A
Bought by
Heritage First Bank Inc
Purchase Details
Closed on
Sep 19, 1994
Sold by
Sambitan Rolando and Sambitan Zenaida M
Bought by
Laipple Alison A
Purchase Details
Closed on
May 29, 1990
Sold by
Johnston David M and Johnston Minerva
Bought by
Sambitan Rolando and Sambitan Zenaida M
Purchase Details
Closed on
Feb 17, 1978
Sold by
Johnston W R
Bought by
Johnston David M and Johnston Minerva
Purchase Details
Closed on
Aug 27, 1974
Sold by
Johnston James F and W R
Bought by
Johnston W R
Purchase Details
Closed on
Mar 21, 1973
Sold by
Beall Mrs Mary Evelyn Remarried
Bought by
Johnston James F and W R
Purchase Details
Closed on
Jan 2, 1962
Sold by
Dudley Mrs Mary Evelyn
Bought by
Beall Mrs Mary Evelyn Remarried
Purchase Details
Closed on
Jan 1, 1962
Bought by
Dudley Mrs Mary Evelyn
Create a Home Valuation Report for This Property
The Home Valuation Report is an in-depth analysis detailing your home's value as well as a comparison with similar homes in the area
Home Values in the Area
Average Home Value in this Area
Purchase History
| Date | Buyer | Sale Price | Title Company |
|---|---|---|---|
| Wrens Nest Properties Llc | -- | -- | |
| Wrens Nest Properties Llc | $1,200,000 | -- | |
| Heritage First Bank Inc | $70,000 | -- | |
| Laipple Alison A | $47,000 | -- | |
| Sambitan Rolando | $45,000 | -- | |
| Johnston David M | $16,500 | -- | |
| Johnston W R | -- | -- | |
| Johnston James F | -- | -- | |
| Beall Mrs Mary Evelyn Remarried | -- | -- | |
| Dudley Mrs Mary Evelyn | -- | -- |
Source: Public Records
Tax History
| Year | Tax Paid | Tax Assessment Tax Assessment Total Assessment is a certain percentage of the fair market value that is determined by local assessors to be the total taxable value of land and additions on the property. | Land | Improvement |
|---|---|---|---|---|
| 2025 | $6,892 | $192,785 | $84,051 | $108,734 |
| 2024 | $6,892 | $202,044 | $88,088 | $113,956 |
| 2023 | $6,082 | $175,260 | $88,088 | $87,172 |
| 2022 | $5,862 | $160,646 | $80,080 | $80,566 |
| 2021 | $5,953 | $160,434 | $80,080 | $80,354 |
| 2020 | $4,955 | $132,420 | $52,052 | $80,368 |
| 2019 | $4,739 | $128,034 | $52,052 | $75,982 |
| 2018 | $4,773 | $128,949 | $52,052 | $76,897 |
| 2017 | $4,808 | $129,865 | $52,052 | $77,813 |
| 2016 | $3,835 | $103,260 | $52,040 | $51,220 |
| 2015 | $2,708 | $77,220 | $26,000 | $51,220 |
| 2014 | $2,708 | $77,220 | $26,000 | $51,220 |
Source: Public Records
Map
Nearby Homes
- 209 Moultrie Ln SE
- 311 Roswell Ave SE
- 801 Maple Ave SW
- 416 E 9th St SE
- 9 Eastridge Ct SW
- 415 E 10th St SE
- 2 Coral Ave SW
- 307 E 11th St SE
- 31 Notasulga Dr SW
- 811 Collinwood Rd SE
- 803/805 Maple Ave SW
- 803/80 Maple Ave SW
- 29 Pear St
- 162 E 11th St SE
- 320 E 3rd Ave
- 166 E 11th St SW
- 170 E 11th St SW
- 1 E 11th St SW
- 168 E 11th St SE
- 164 E 11th St SE
- 315 E 7th St SW
- 312 2 E 7th St Unit 2
- 312 SW E 7th
- 312 SW E 7th Unit 8
- 312 SW E 7th Unit 9
- 313 E 7th St SW
- 311 E 7th St SW
- 312 E 7th St SW Unit 15
- 312 E 7th St SW Unit 12
- 312 E 7th St SW Unit 13
- 312 E 7th St SW Unit 14
- 312 E 7th St SW Unit 16
- 312 E 7th St SW Unit 17
- 312 E 7th St SW Unit 18
- 312 E 7th St SW Unit 19
- 312 E 7th St SW Unit 11
- 312 E 7th St SW Unit 10
- 312 E 7th St SW Unit 9
- 312 E 7th St SW Unit 8
- 312 E 7th St SW Unit 7
Your Personal Tour Guide
Ask me questions while you tour the home.