Estimated Value: $405,469 - $456,000
3
Beds
1
Bath
1,030
Sq Ft
$417/Sq Ft
Est. Value
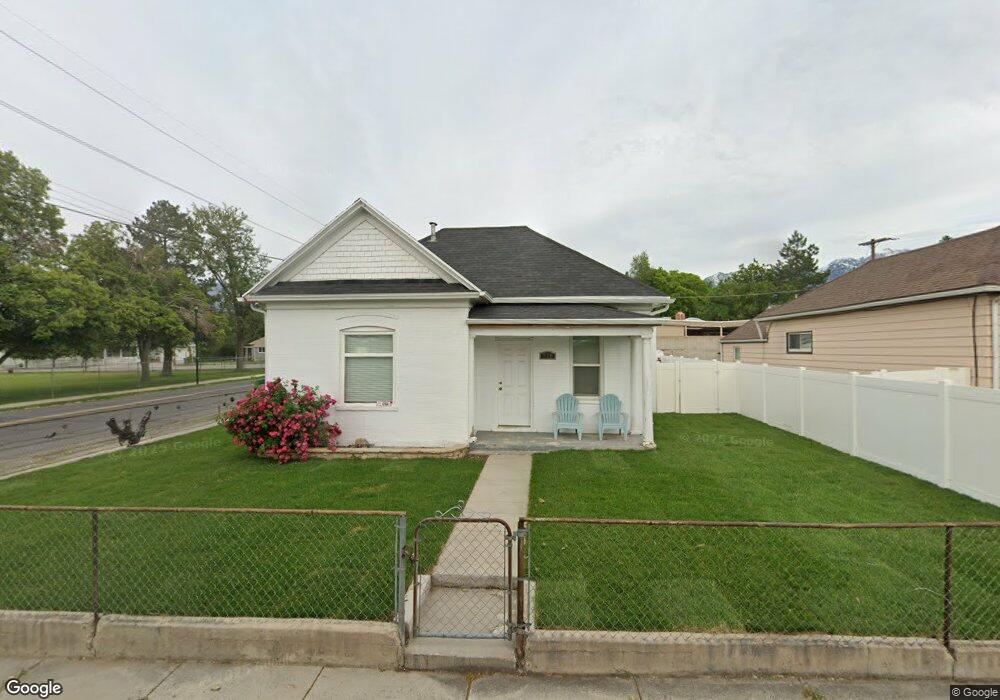
About This Home
This home is located at 316 E 8800 S, Sandy, UT 84070 and is currently estimated at $429,617, approximately $417 per square foot. 316 E 8800 S is a home located in Salt Lake County with nearby schools including Sandy Elementary School, Mount Jordan Middle School, and Jordan High.
Ownership History
Date
Name
Owned For
Owner Type
Purchase Details
Closed on
May 9, 2019
Sold by
Greystone Investments Llc
Bought by
Sibert Jo
Current Estimated Value
Home Financials for this Owner
Home Financials are based on the most recent Mortgage that was taken out on this home.
Original Mortgage
$254,000
Outstanding Balance
$222,406
Interest Rate
4%
Mortgage Type
New Conventional
Estimated Equity
$207,211
Purchase Details
Closed on
Dec 13, 2018
Sold by
Olsen Joan D
Bought by
Greystone Investments Llc
Purchase Details
Closed on
Jul 15, 2002
Sold by
Minor Richard Neal and Minor Sandra Jean
Bought by
Olsen Joan D
Home Financials for this Owner
Home Financials are based on the most recent Mortgage that was taken out on this home.
Original Mortgage
$74,600
Interest Rate
6.69%
Create a Home Valuation Report for This Property
The Home Valuation Report is an in-depth analysis detailing your home's value as well as a comparison with similar homes in the area
Home Values in the Area
Average Home Value in this Area
Purchase History
| Date | Buyer | Sale Price | Title Company |
|---|---|---|---|
| Sibert Jo | -- | Title Guarantee Fort Union | |
| Greystone Investments Llc | -- | Title Guarantee | |
| Olsen Joan D | -- | First American Title |
Source: Public Records
Mortgage History
| Date | Status | Borrower | Loan Amount |
|---|---|---|---|
| Open | Sibert Jo | $254,000 | |
| Previous Owner | Olsen Joan D | $74,600 |
Source: Public Records
Tax History
| Year | Tax Paid | Tax Assessment Tax Assessment Total Assessment is a certain percentage of the fair market value that is determined by local assessors to be the total taxable value of land and additions on the property. | Land | Improvement |
|---|---|---|---|---|
| 2025 | $1,861 | $395,300 | $101,400 | $293,900 |
| 2024 | $1,861 | $344,100 | $93,000 | $251,100 |
| 2023 | $1,861 | $310,300 | $88,400 | $221,900 |
| 2022 | $1,784 | $321,300 | $86,700 | $234,600 |
| 2021 | $1,709 | $262,000 | $67,900 | $194,100 |
| 2020 | $1,587 | $229,500 | $67,900 | $161,600 |
| 2019 | $1,113 | $156,800 | $64,500 | $92,300 |
| 2018 | $15 | $140,600 | $50,100 | $90,500 |
| 2017 | $0 | $132,500 | $46,400 | $86,100 |
| 2016 | $0 | $129,500 | $46,400 | $83,100 |
| 2015 | $37 | $122,000 | $47,300 | $74,700 |
| 2014 | $5 | $115,900 | $48,400 | $67,500 |
Source: Public Records
Map
Nearby Homes
- 412 E 8760 S
- 270 E 8680 S
- 8558 S Center St
- 8732 S 620 E
- 112 E 8680 S
- 220 E Pioneer Ave
- 194 Pioneer Ave
- 8459 S 300 E
- 362 E 9150 S
- 149 E Pioneer Ave
- 227 E St Germain Way
- 181 E 9180 S
- 359 E 8400 S
- 8729 S Leafwood Ln
- 8797 Green Way Unit 3
- 87 Pioneer Ave
- 8722 S Oakwood Park Cir
- 8732 S Oakwood Park Cr
- 8470 Solar Way
- 487 E 9270 S
Your Personal Tour Guide
Ask me questions while you tour the home.