G
Seller's Agent in 2025
Garrett Riggs
Peak Real Estate
(262) 206-5948
2 in this area
48 Total Sales
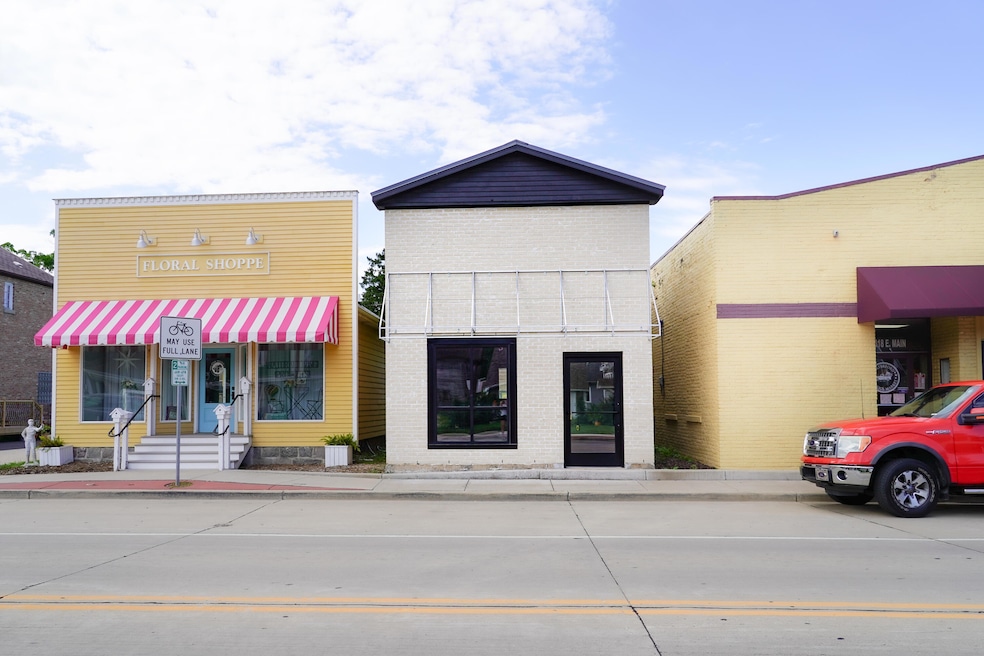
Location is key! Bring your retail business to the beautiful Village of Waterford with this unbeatable location. Whether you are just starting out or looking to expand, the charm of this property will suit your needs. Schedule your private showing today! Property is also listed for rent MLS#1909585
Last Agent to Sell the Property
Peak Real Estate License #60059-90 Listed on: 03/12/2025
| Date | Type | Sale Price | Title Company |
|---|---|---|---|
| Warranty Deed | $121,500 | Fidelity Title | |
| Warranty Deed | $135,000 | Fidelity Title | |
| Warranty Deed | $95,000 | Fidelity Title Inc | |
| Warranty Deed | -- | None Available | |
| Land Contract | $79,000 | None Available | |
| Quit Claim Deed | $40,000 | -- |
| Date | Status | Loan Amount | Loan Type |
|---|---|---|---|
| Previous Owner | $101,250 | Construction | |
| Previous Owner | $95,000 | New Conventional | |
| Previous Owner | $76,000 | Purchase Money Mortgage |
| Date | Event | Price | List to Sale | Price per Sq Ft |
|---|---|---|---|---|
| 08/15/2025 08/15/25 | Sold | $121,500 | -10.0% | $193 / Sq Ft |
| 07/25/2025 07/25/25 | Pending | -- | -- | -- |
| 07/01/2025 07/01/25 | Price Changed | $135,000 | -6.9% | $215 / Sq Ft |
| 04/17/2025 04/17/25 | Price Changed | $145,000 | -2.7% | $231 / Sq Ft |
| 03/12/2025 03/12/25 | For Sale | $149,000 | -- | $237 / Sq Ft |
| Year | Tax Paid | Tax Assessment Tax Assessment Total Assessment is a certain percentage of the fair market value that is determined by local assessors to be the total taxable value of land and additions on the property. | Land | Improvement |
|---|---|---|---|---|
| 2025 | $1,544 | $105,700 | $17,500 | $88,200 |
| 2024 | $1,563 | $107,000 | $17,500 | $89,500 |
| 2023 | $1,632 | $107,000 | $17,500 | $89,500 |
| 2022 | $2,466 | $97,300 | $17,500 | $79,800 |
| 2021 | $2,445 | $97,300 | $17,500 | $79,800 |
| 2020 | $2,391 | $72,400 | $16,000 | $56,400 |
| 2019 | $1,593 | $72,400 | $16,000 | $56,400 |
| 2018 | $2,353 | $72,400 | $16,000 | $56,400 |
| 2017 | $1,448 | $72,400 | $16,000 | $56,400 |
| 2016 | $1,483 | $72,400 | $16,000 | $56,400 |
| 2015 | $1,583 | $72,400 | $16,000 | $56,400 |
| 2014 | $879 | $45,200 | $11,000 | $34,200 |
| 2013 | $909 | $45,200 | $11,000 | $34,200 |
G
Seller's Agent in 2025
Garrett Riggs
Peak Real Estate
(262) 206-5948
2 in this area
48 Total Sales
B
Buyer's Agent in 2025
Bob Selensky
Parkway Realty, LLC
(414) 651-5546
22 in this area
278 Total Sales
Source: Metro MLS
MLS Number: 1909592
APN: 191-041935294000
Disclaimer: Certain information contained herein is derived from information provided by parties other than Homes.com. All information provided is deemed reliable, but is not guaranteed to be accurate and should be independently verified.
![]() IDX information is provided exclusively for personal, non-commercial use, and may not be used for any purpose other than to identify prospective properties consumers may be interested in purchasing.
IDX information is provided exclusively for personal, non-commercial use, and may not be used for any purpose other than to identify prospective properties consumers may be interested in purchasing.
IDX listing data provided by Multiple Listing Service, Inc. Information is supplied by seller and other third parties and has not been verified.
Copyright 2026 – Multiple Listing Service, Inc. – All Rights Reserved.
Ask me questions while you tour the home.
