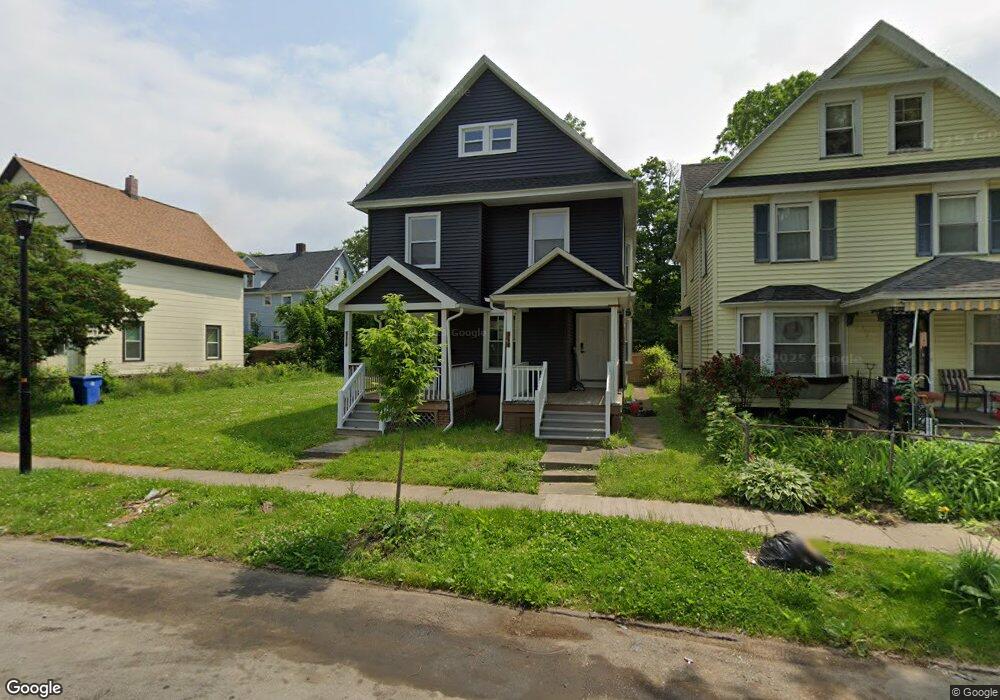
316 Epworth St Unit 318 Rochester, NY 14611
Genesee-Jefferson NeighborhoodEstimated Value: $48,000 - $140,719
4
Beds
2
Baths
2,192
Sq Ft
$44/Sq Ft
Est. Value
About This Home
This home is located at 316 Epworth St Unit 318, Rochester, NY 14611 and is currently estimated at $95,680, approximately $43 per square foot. 316 Epworth St Unit 318 is a home located in Monroe County with nearby schools including School 19 Dr Charles T Lunsford, George Mather Forbes School No. 4, and Adlai E. Stevenson School 29.
Ownership History
Date
Name
Owned For
Owner Type
Purchase Details
Closed on
Oct 2, 2023
Sold by
Turner William J
Bought by
Smith Terry
Current Estimated Value
Home Financials for this Owner
Home Financials are based on the most recent Mortgage that was taken out on this home.
Original Mortgage
$173,891
Outstanding Balance
$168,657
Interest Rate
7.09%
Mortgage Type
FHA
Estimated Equity
-$72,977
Purchase Details
Closed on
Oct 20, 2021
Sold by
Yitzhak Brinkman
Bought by
Turner William J
Purchase Details
Closed on
May 15, 2014
Sold by
316 Epworth Street Llc
Bought by
Brinkman Yitzhak
Purchase Details
Closed on
Jan 22, 2011
Sold by
Geomania Ventures Llc
Bought by
316 Epworth Street Llc
Purchase Details
Closed on
May 15, 2002
Sold by
Central City Properties
Bought by
Dts Properties Inc
Purchase Details
Closed on
Mar 19, 1999
Purchase Details
Closed on
Sep 23, 1996
Create a Home Valuation Report for This Property
The Home Valuation Report is an in-depth analysis detailing your home's value as well as a comparison with similar homes in the area
Home Values in the Area
Average Home Value in this Area
Purchase History
| Date | Buyer | Sale Price | Title Company |
|---|---|---|---|
| Smith Terry | $42,500 | None Listed On Document | |
| Turner William J | $15,000 | None Listed On Document | |
| Brinkman Yitzhak | -- | None Available | |
| 316 Epworth Street Llc | $10,000 | None Available | |
| Dts Properties Inc | $16,500 | Joseph Lafay | |
| -- | $8,000 | -- | |
| -- | -- | -- |
Source: Public Records
Mortgage History
| Date | Status | Borrower | Loan Amount |
|---|---|---|---|
| Open | Smith Terry | $173,891 |
Source: Public Records
Tax History Compared to Growth
Tax History
| Year | Tax Paid | Tax Assessment Tax Assessment Total Assessment is a certain percentage of the fair market value that is determined by local assessors to be the total taxable value of land and additions on the property. | Land | Improvement |
|---|---|---|---|---|
| 2024 | $398 | $42,500 | $4,600 | $37,900 |
| 2023 | $402 | $37,000 | $2,700 | $34,300 |
| 2022 | $401 | $37,000 | $2,700 | $34,300 |
| 2021 | $463 | $35,900 | $2,700 | $33,200 |
| 2020 | $326 | $35,900 | $2,700 | $33,200 |
| 2019 | $544 | $25,000 | $2,700 | $22,300 |
| 2018 | $1,826 | $25,000 | $2,700 | $22,300 |
| 2017 | $1,826 | $25,000 | $2,700 | $22,300 |
| 2016 | $544 | $25,000 | $2,700 | $22,300 |
| 2015 | -- | $20,000 | $2,700 | $17,300 |
| 2014 | -- | $20,000 | $2,700 | $17,300 |
Source: Public Records
Map
Nearby Homes
- 21 Arnett Blvd Unit 25
- 68 Arnett Blvd
- 672 Jefferson Ave
- 16 Shelter St
- 358 Champlain St
- 329 Frost Ave
- 246 Columbia Ave
- 164 Cady St Unit 5
- 244 Kenwood Ave
- 137 Aldine St
- 215 Reynolds St
- 151 Hawley St
- 109 Cady St
- 687 Genesee St
- 359 Wellington Ave
- 399 Cottage St
- 594 Tremont St
- 422 Seward St
- 572-574 Seward St
- 376-378 Jefferson Ave
- 316-318 Epworth St
- 320 Epworth St
- 324 Epworth St Unit 326
- 306 Epworth St
- 189 Bartlett St Unit 191
- 2-4 Arnett Blvd
- 187 Bartlett St
- 302 Epworth St
- 2 Arnett Blvd
- 23 Florence St
- 13 Florence St
- 24 Arnett Blvd
- 185 Bartlett St
- 13 Arnett Blvd
- 31 Florence St
- 436 Columbia Ave
- 430 Columbia Ave
- 444 Columbia Ave Unit 448
- 183 Bartlett St
- 8 Arnett Blvd