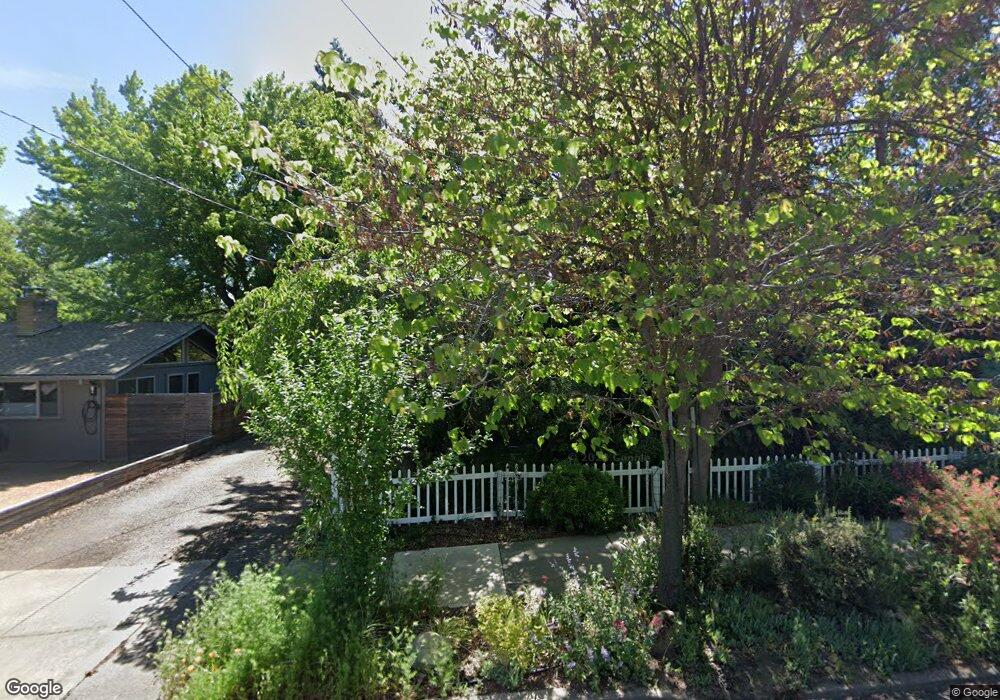
316 Helman St Ashland, OR 97520
Cottage District NeighborhoodEstimated Value: $427,000 - $590,000
3
Beds
1
Bath
1,320
Sq Ft
$374/Sq Ft
Est. Value
About This Home
This home is located at 316 Helman St, Ashland, OR 97520 and is currently estimated at $494,129, approximately $374 per square foot. 316 Helman St is a home located in Jackson County with nearby schools including Helman Elementary School, Ashland Middle School, and Ashland High School.
Ownership History
Date
Name
Owned For
Owner Type
Purchase Details
Closed on
Dec 17, 2010
Sold by
Visser Dondi Fawn and Visser Marianna
Bought by
Visser Marianna and Visser Dondi Fawn
Current Estimated Value
Home Financials for this Owner
Home Financials are based on the most recent Mortgage that was taken out on this home.
Original Mortgage
$168,000
Interest Rate
4.17%
Mortgage Type
New Conventional
Purchase Details
Closed on
Jan 5, 2007
Sold by
Visser Marianna and Ford Dondi F
Bought by
Visser Marianna and Visser Dondi Fawn
Purchase Details
Closed on
Nov 21, 2001
Sold by
Ford Visser Dondi Fawn and Visser Marianna
Bought by
Ford Visser Dondi Fawn and Visser Marianna
Home Financials for this Owner
Home Financials are based on the most recent Mortgage that was taken out on this home.
Original Mortgage
$120,000
Interest Rate
6.57%
Create a Home Valuation Report for This Property
The Home Valuation Report is an in-depth analysis detailing your home's value as well as a comparison with similar homes in the area
Home Values in the Area
Average Home Value in this Area
Purchase History
| Date | Buyer | Sale Price | Title Company |
|---|---|---|---|
| Visser Marianna | -- | Ticor Title Company Oregon | |
| Visser Dondi Fawn | -- | Ticor Title Company Oregon | |
| Visser Marianna | -- | None Available | |
| Ford Visser Dondi Fawn | -- | Amerititle |
Source: Public Records
Mortgage History
| Date | Status | Borrower | Loan Amount |
|---|---|---|---|
| Closed | Visser Dondi Fawn | $168,000 | |
| Closed | Ford Visser Dondi Fawn | $120,000 |
Source: Public Records
Tax History Compared to Growth
Tax History
| Year | Tax Paid | Tax Assessment Tax Assessment Total Assessment is a certain percentage of the fair market value that is determined by local assessors to be the total taxable value of land and additions on the property. | Land | Improvement |
|---|---|---|---|---|
| 2025 | $3,636 | $234,510 | $117,960 | $116,550 |
| 2024 | $3,636 | $227,680 | $114,520 | $113,160 |
| 2023 | $3,517 | $221,050 | $111,190 | $109,860 |
| 2022 | $3,405 | $221,050 | $111,190 | $109,860 |
| 2021 | $3,289 | $214,620 | $107,960 | $106,660 |
| 2020 | $3,197 | $208,370 | $104,820 | $103,550 |
| 2019 | $3,146 | $196,420 | $98,820 | $97,600 |
| 2018 | $2,972 | $190,700 | $95,940 | $94,760 |
| 2017 | $2,950 | $190,700 | $95,940 | $94,760 |
| 2016 | $2,873 | $179,760 | $90,430 | $89,330 |
| 2015 | $2,762 | $179,760 | $90,430 | $89,330 |
| 2014 | -- | $169,450 | $85,230 | $84,220 |
Source: Public Records
Map
Nearby Homes