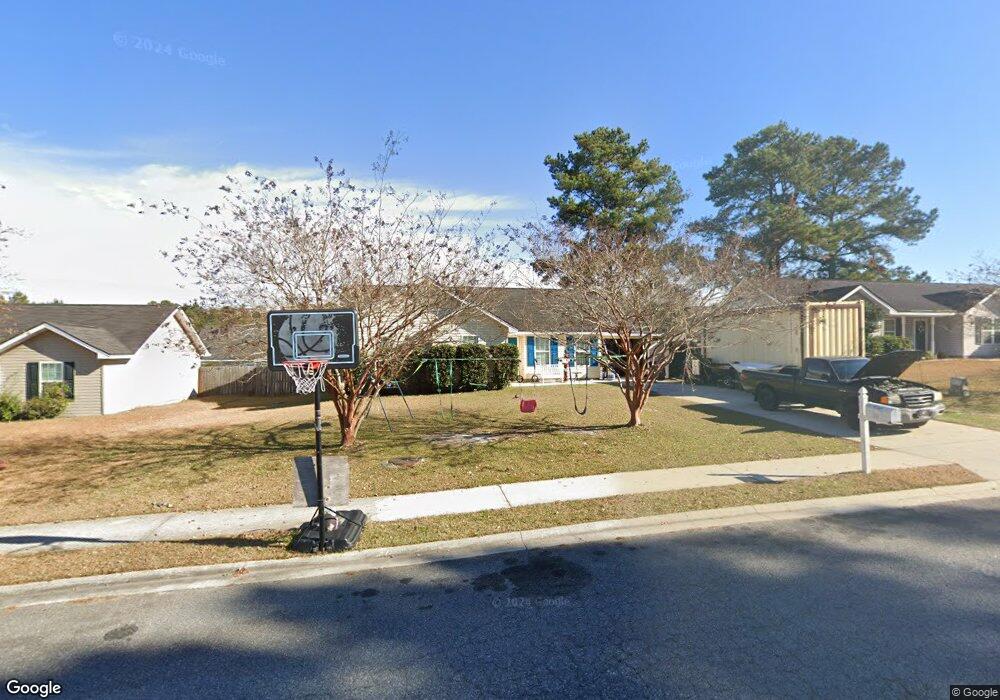
316 Kelly Ave Unit 94 Rincon, GA 31326
Estimated Value: $260,269 - $268,000
3
Beds
2
Baths
1,090
Sq Ft
$243/Sq Ft
Est. Value
About This Home
This home is located at 316 Kelly Ave Unit 94, Rincon, GA 31326 and is currently estimated at $264,567, approximately $242 per square foot. 316 Kelly Ave Unit 94 is a home located in Effingham County with nearby schools including Rincon Elementary School, Ebenezer Middle School, and Effingham County High School.
Ownership History
Date
Name
Owned For
Owner Type
Purchase Details
Closed on
Aug 11, 2017
Sold by
Edenfield Investment Props Llc
Bought by
Fowler Donald and Fowler Hope A
Current Estimated Value
Home Financials for this Owner
Home Financials are based on the most recent Mortgage that was taken out on this home.
Original Mortgage
$119,191
Outstanding Balance
$99,643
Interest Rate
4.03%
Mortgage Type
New Conventional
Estimated Equity
$164,924
Purchase Details
Closed on
Aug 5, 2005
Sold by
Edenfield Michael L
Bought by
Edenfield Investment Propertie
Home Financials for this Owner
Home Financials are based on the most recent Mortgage that was taken out on this home.
Original Mortgage
$79,600
Interest Rate
5.59%
Mortgage Type
New Conventional
Purchase Details
Closed on
Jul 14, 2005
Sold by
N & J Land Corp Inc
Bought by
Edenfield Michael L and Edenfield Virginai M
Home Financials for this Owner
Home Financials are based on the most recent Mortgage that was taken out on this home.
Original Mortgage
$79,600
Interest Rate
5.59%
Mortgage Type
New Conventional
Create a Home Valuation Report for This Property
The Home Valuation Report is an in-depth analysis detailing your home's value as well as a comparison with similar homes in the area
Home Values in the Area
Average Home Value in this Area
Purchase History
| Date | Buyer | Sale Price | Title Company |
|---|---|---|---|
| Fowler Donald | $118,000 | -- | |
| Edenfield Investment Propertie | -- | -- | |
| Edenfield Michael L | $99,500 | -- |
Source: Public Records
Mortgage History
| Date | Status | Borrower | Loan Amount |
|---|---|---|---|
| Open | Fowler Donald | $119,191 | |
| Previous Owner | Edenfield Michael L | $79,600 |
Source: Public Records
Tax History Compared to Growth
Tax History
| Year | Tax Paid | Tax Assessment Tax Assessment Total Assessment is a certain percentage of the fair market value that is determined by local assessors to be the total taxable value of land and additions on the property. | Land | Improvement |
|---|---|---|---|---|
| 2024 | $2,179 | $85,185 | $22,800 | $62,385 |
| 2023 | $1,671 | $68,554 | $17,600 | $50,954 |
| 2022 | $1,557 | $59,130 | $17,600 | $41,530 |
| 2021 | $1,388 | $51,906 | $14,000 | $37,906 |
| 2020 | $1,441 | $49,492 | $12,000 | $37,492 |
| 2019 | $1,292 | $45,102 | $12,000 | $33,102 |
| 2018 | $1,254 | $44,866 | $10,000 | $34,866 |
| 2017 | $1,251 | $44,098 | $9,560 | $34,538 |
| 2016 | $1,258 | $43,938 | $13,600 | $30,338 |
| 2015 | -- | $37,538 | $7,200 | $30,338 |
| 2014 | -- | $42,338 | $12,000 | $30,338 |
| 2013 | -- | $36,738 | $6,400 | $30,338 |
Source: Public Records
Map
Nearby Homes
- 136 Fraser Ln
- 138 Fraser Ln
- 125 Fraser Ln
- 301 Pebble Dr
- 124 Tolliver Ln
- 107 Stonewalk Dr
- 216 Market St
- 114 Stonewalk Dr
- 156 Stonewalk Dr
- 225 Jasper Ln
- 233 Jasper Ln
- 601 Heathcliff Ct
- 206 Boulder Ct
- 119 Fox Trace
- 145 Sweetwater Cir
- 226 Oxford Cir
- 267 Jasper Ln
- 144 Sweetwater Cir
- 417 Keiffer Dr
- 107 Amber Dr