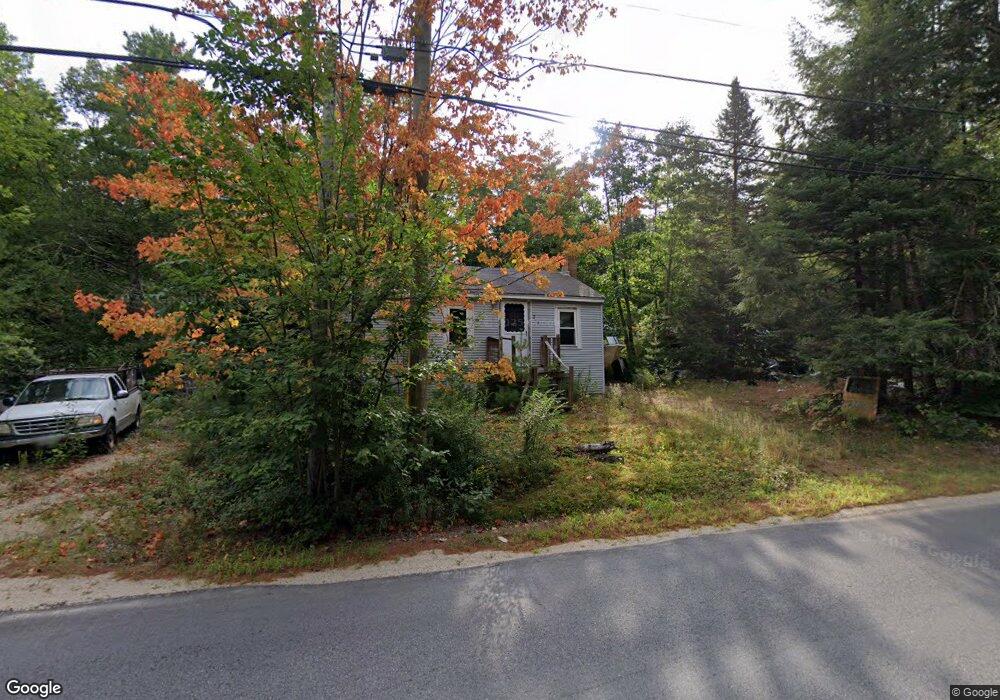
316 Libby Rd West Newfield, ME 04095
Newfield NeighborhoodEstimated Value: $273,482 - $297,000
2
Beds
1
Bath
696
Sq Ft
$413/Sq Ft
Est. Value
About This Home
This home is located at 316 Libby Rd, West Newfield, ME 04095 and is currently estimated at $287,494, approximately $413 per square foot. 316 Libby Rd is a home located in York County with nearby schools including Massabesic High School.
Ownership History
Date
Name
Owned For
Owner Type
Purchase Details
Closed on
Nov 22, 2024
Sold by
Anthony J Delgenio Ret and Delgenio
Bought by
Delgenio Paul N
Current Estimated Value
Purchase Details
Closed on
Feb 24, 2014
Sold by
Delgenio Anthony J
Bought by
Anthony J Delgenio Ret and Delgenio Anthony J
Purchase Details
Closed on
Feb 1, 2011
Sold by
Murphy Scott W
Bought by
Wells Fargo Bank Na and Murphy Scott W
Create a Home Valuation Report for This Property
The Home Valuation Report is an in-depth analysis detailing your home's value as well as a comparison with similar homes in the area
Home Values in the Area
Average Home Value in this Area
Purchase History
| Date | Buyer | Sale Price | Title Company |
|---|---|---|---|
| Delgenio Paul N | -- | None Available | |
| Delgenio Paul N | -- | None Available | |
| Anthony J Delgenio Ret | -- | -- | |
| Wells Fargo Bank Na | -- | -- | |
| Anthony J Delgenio Ret | -- | -- | |
| Wells Fargo Bank Na | -- | -- |
Source: Public Records
Tax History Compared to Growth
Tax History
| Year | Tax Paid | Tax Assessment Tax Assessment Total Assessment is a certain percentage of the fair market value that is determined by local assessors to be the total taxable value of land and additions on the property. | Land | Improvement |
|---|---|---|---|---|
| 2024 | $1,817 | $154,000 | $84,400 | $69,600 |
| 2023 | $1,682 | $154,000 | $84,400 | $69,600 |
| 2022 | $1,375 | $140,900 | $84,400 | $56,500 |
| 2021 | $1,283 | $112,700 | $67,500 | $45,200 |
| 2020 | $1,283 | $112,700 | $67,500 | $45,200 |
| 2019 | $1,255 | $112,700 | $67,500 | $45,200 |
| 2018 | $1,233 | $112,700 | $67,500 | $45,200 |
| 2017 | $3,527 | $112,700 | $67,500 | $45,200 |
| 2016 | $1,184 | $112,700 | $67,500 | $45,200 |
| 2015 | $1,098 | $112,700 | $67,500 | $45,200 |
| 2014 | $1,061 | $114,100 | $78,000 | $36,100 |
| 2013 | $1,027 | $114,100 | $78,000 | $36,100 |
Source: Public Records
Map
Nearby Homes
- 315 Libby Rd
- 0 Island Dr
- 57 Green Bay Rd
- 20 Shepard's Island Rd
- 0 Whitehouse Rd
- Parcel #1 Sanborn Rd
- 367 Shady Nook Rd
- 00 Libby Rd Unit Lot 9
- 174 Wakefield Rd
- 253 Asbury Ln
- 1089 Maplewood Rd
- 1 Corson Rd
- TBD Wakefield Rd
- 51 Mill Pond Rd
- 350 Concord Ln Unit 20
- 322 Concord Ln
- 112 Gile Rd
- 84 Shady Nook Rd
- 122 Onamor Dr
- 8 Eliot Dr