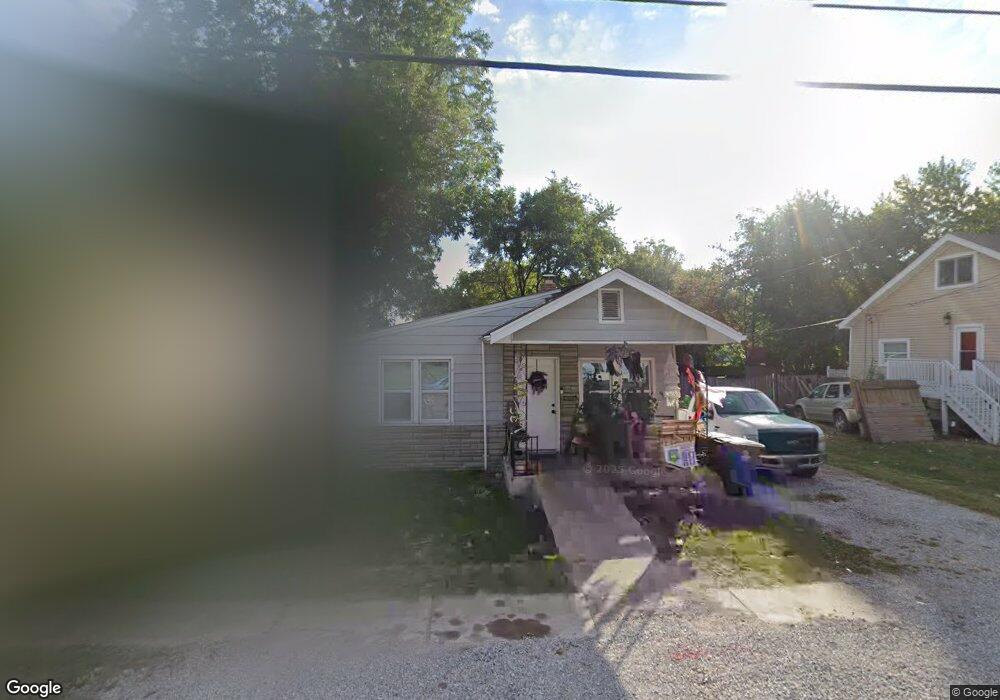
316 Little Broadway St Saint Louis, MO 63125
Lemay NeighborhoodEstimated Value: $121,000 - $152,000
2
Beds
1
Bath
1,075
Sq Ft
$131/Sq Ft
Est. Value
About This Home
This home is located at 316 Little Broadway St, Saint Louis, MO 63125 and is currently estimated at $140,868, approximately $131 per square foot. 316 Little Broadway St is a home located in St. Louis County with nearby schools including Hancock Place Elementary School, Hancock Place Middle School, and Hancock Place High School.
Ownership History
Date
Name
Owned For
Owner Type
Purchase Details
Closed on
May 30, 2025
Sold by
Le My-Chau and Huynh Dong
Bought by
C Huynh Properties Llc
Current Estimated Value
Purchase Details
Closed on
May 2, 2016
Sold by
Therman White
Bought by
Le My Chau
Purchase Details
Closed on
Feb 4, 2005
Sold by
Doran Realty Co
Bought by
White Therman
Home Financials for this Owner
Home Financials are based on the most recent Mortgage that was taken out on this home.
Original Mortgage
$42,500
Interest Rate
5.75%
Mortgage Type
Purchase Money Mortgage
Purchase Details
Closed on
Jun 5, 2000
Sold by
Carl Doyle
Bought by
Doran Realty Company
Purchase Details
Closed on
Dec 31, 1996
Sold by
Doran Realty Company
Bought by
Doyle Carl and Doyle Connie
Home Financials for this Owner
Home Financials are based on the most recent Mortgage that was taken out on this home.
Original Mortgage
$22,000
Interest Rate
9.5%
Create a Home Valuation Report for This Property
The Home Valuation Report is an in-depth analysis detailing your home's value as well as a comparison with similar homes in the area
Home Values in the Area
Average Home Value in this Area
Purchase History
| Date | Buyer | Sale Price | Title Company |
|---|---|---|---|
| C Huynh Properties Llc | -- | None Listed On Document | |
| Le My Chau | $3,861 | None Available | |
| White Therman | $42,500 | Ust | |
| Doran Realty Company | -- | -- | |
| Doyle Carl | -- | -- |
Source: Public Records
Mortgage History
| Date | Status | Borrower | Loan Amount |
|---|---|---|---|
| Previous Owner | White Therman | $42,500 | |
| Previous Owner | Doyle Carl | $22,000 | |
| Closed | Doyle Carl | $15,500 |
Source: Public Records
Tax History Compared to Growth
Tax History
| Year | Tax Paid | Tax Assessment Tax Assessment Total Assessment is a certain percentage of the fair market value that is determined by local assessors to be the total taxable value of land and additions on the property. | Land | Improvement |
|---|---|---|---|---|
| 2025 | $1,931 | $27,090 | $11,720 | $15,370 |
| 2024 | $1,931 | $24,870 | $4,690 | $20,180 |
| 2023 | $1,931 | $24,870 | $4,690 | $20,180 |
| 2022 | $1,622 | $19,900 | $5,420 | $14,480 |
| 2021 | $1,594 | $19,900 | $5,420 | $14,480 |
| 2020 | $1,451 | $17,280 | $5,420 | $11,860 |
| 2019 | $1,447 | $17,280 | $5,420 | $11,860 |
| 2018 | $643 | $6,530 | $4,140 | $2,390 |
| 2017 | $632 | $6,530 | $4,140 | $2,390 |
| 2016 | $542 | $5,360 | $1,540 | $3,820 |
Source: Public Records
Map
Nearby Homes
- 8626 Shoss Ave
- 252 Wachtel Ave
- 241 Dammert Ave
- 622 Kayser Ave
- 8523 Idaho Ave
- 610 Kayser Ave
- 235 Military Rd
- 8439 Tennessee Ave
- 300 Kayser Ave
- 302 Waller Ave
- 711 Erskine Ave
- 712 Pardella Ave
- 715 Erskine Ave
- 514 E Dallas Ct
- 720 Erskine Ave
- 335 Horn Ave
- 3708 Comstock Dr
- 3720 Comstock Dr
- 765 Pardella Ave Unit A
- 324 Hurck St
- 314 Little Broadway St
- 318 Little Broadway St
- 221 Courtland Ave
- 217 Courtland Ave
- 215 Courtland Ave
- 219 Courtland Ave
- 322 Little Broadway St
- 8641 Shoss Ave
- 8708 S Grand Ave
- 324 Little Broadway St
- 225 Courtland Ave
- 8712 S Grand Ave
- 8642 Shoss Ave
- 8637 Shoss Ave
- 326 Little Broadway St
- 8652 S Grand Ave
- 8638 Shoss Ave
- 8716 S Grand Ave
- 218 Courtland Ave
- 8633 Shoss Ave