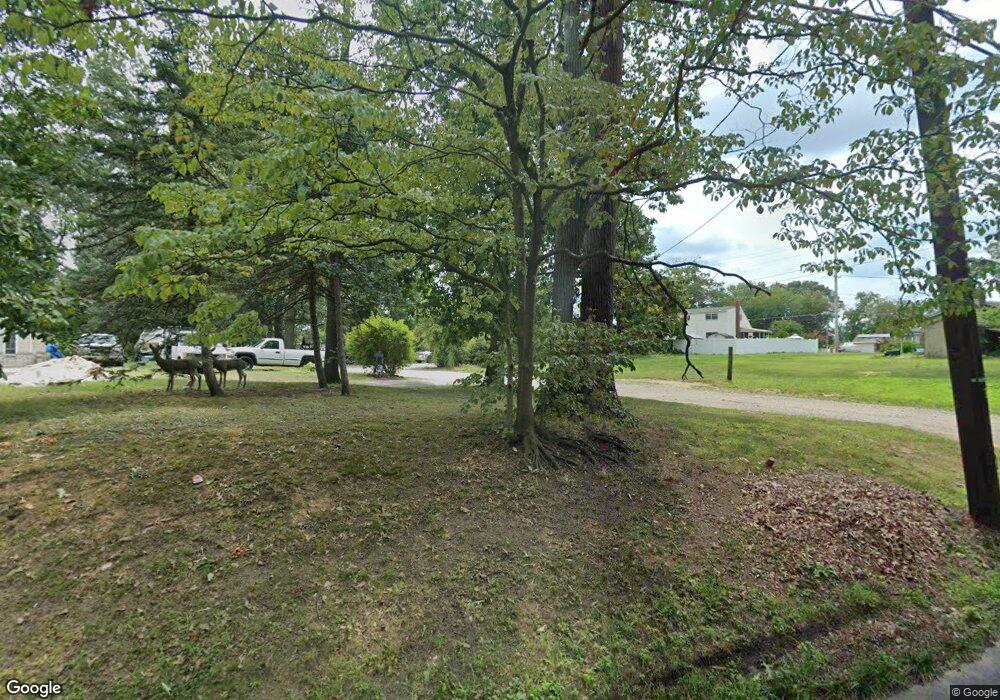
316 Maple Ave Blackwood, NJ 08012
Estimated Value: $332,912 - $363,000
Studio
--
Bath
1,322
Sq Ft
$262/Sq Ft
Est. Value
About This Home
This home is located at 316 Maple Ave, Blackwood, NJ 08012 and is currently estimated at $346,478, approximately $262 per square foot. 316 Maple Ave is a home located in Camden County with nearby schools including Glen Landing Middle School, Triton High School, and St. Teresa Regional School.
Ownership History
Date
Name
Owned For
Owner Type
Purchase Details
Closed on
Apr 30, 2002
Sold by
Rotz Timothy
Bought by
Nadzieja Linda and Nadzieja Andre
Current Estimated Value
Home Financials for this Owner
Home Financials are based on the most recent Mortgage that was taken out on this home.
Original Mortgage
$136,000
Outstanding Balance
$56,902
Interest Rate
6.8%
Estimated Equity
$289,576
Purchase Details
Closed on
Jul 31, 1998
Sold by
Laratta John J
Bought by
Rotz Timothy and Collins Roseann
Create a Home Valuation Report for This Property
The Home Valuation Report is an in-depth analysis detailing your home's value as well as a comparison with similar homes in the area
Home Values in the Area
Average Home Value in this Area
Purchase History
| Date | Buyer | Sale Price | Title Company |
|---|---|---|---|
| Nadzieja Linda | $141,000 | -- | |
| Rotz Timothy | $115,000 | -- |
Source: Public Records
Mortgage History
| Date | Status | Borrower | Loan Amount |
|---|---|---|---|
| Open | Nadzieja Linda | $136,000 |
Source: Public Records
Tax History
| Year | Tax Paid | Tax Assessment Tax Assessment Total Assessment is a certain percentage of the fair market value that is determined by local assessors to be the total taxable value of land and additions on the property. | Land | Improvement |
|---|---|---|---|---|
| 2025 | $8,501 | $193,700 | $67,400 | $126,300 |
| 2024 | $8,079 | $193,700 | $67,400 | $126,300 |
| 2023 | $8,079 | $193,700 | $67,400 | $126,300 |
| 2022 | $8,021 | $193,700 | $67,400 | $126,300 |
| 2021 | $7,824 | $193,700 | $67,400 | $126,300 |
| 2020 | $7,824 | $193,700 | $67,400 | $126,300 |
| 2019 | $7,653 | $193,700 | $67,400 | $126,300 |
| 2018 | $7,622 | $193,700 | $67,400 | $126,300 |
| 2017 | $7,384 | $193,700 | $67,400 | $126,300 |
| 2016 | $7,225 | $193,700 | $67,400 | $126,300 |
| 2015 | $6,716 | $193,700 | $67,400 | $126,300 |
| 2014 | $6,688 | $193,700 | $67,400 | $126,300 |
Source: Public Records
Map
Nearby Homes
- 239 Lower Landing Rd
- 1 Pine Ct
- 324 Huntington Ave
- 308 Fern Ave
- 211 Chestnut St
- 18 E Front St
- 200 Lake Ave
- 32 Lake Ave
- 329 Ridge Ave
- 1709 Old Black Horse Pike
- 100 Garden Ave
- 516 Huntington Ave
- 535 Main St
- 52 Brown Ave
- 300 3rd Ave
- 217 3rd Ave
- 535 Roosevelt Ave
- 428 Arline Ave
- 810 Central Ave
- 210 Ridge Ave
Your Personal Tour Guide
Ask me questions while you tour the home.