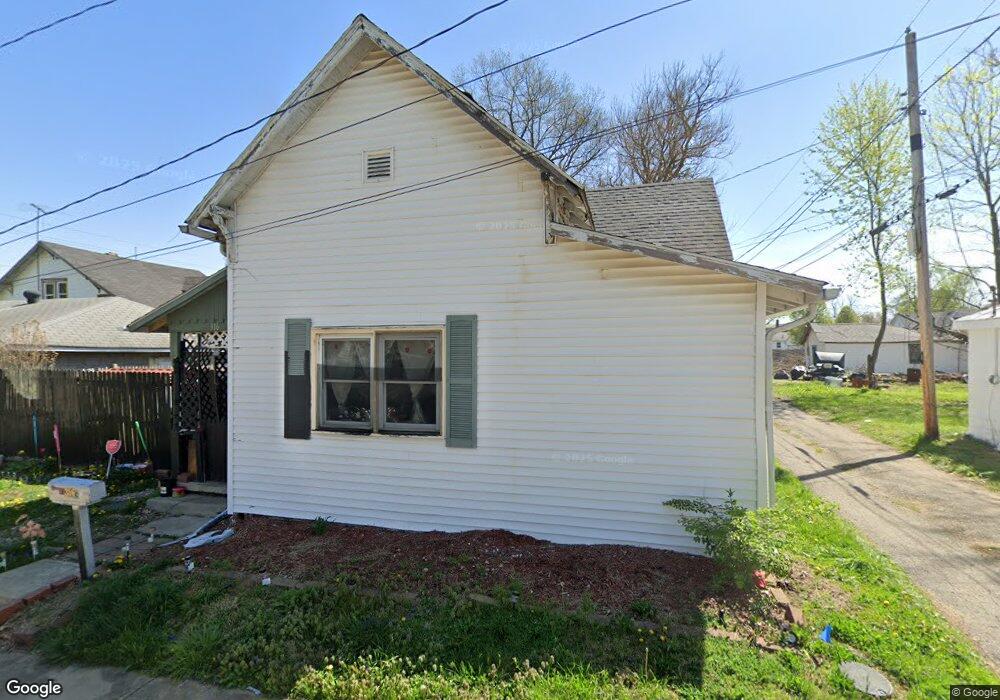
316 Morton St Anderson, IN 46016
Estimated Value: $70,000 - $87,000
2
Beds
1
Bath
1,280
Sq Ft
$60/Sq Ft
Est. Value
About This Home
This home is located at 316 Morton St, Anderson, IN 46016 and is currently estimated at $77,076, approximately $60 per square foot. 316 Morton St is a home located in Madison County with nearby schools including Eastside Elementary School, Highland Middle School, and Anderson High School.
Ownership History
Date
Name
Owned For
Owner Type
Purchase Details
Closed on
Jan 2, 2025
Sold by
Tunstall Trust
Bought by
Carter Azari M
Current Estimated Value
Purchase Details
Closed on
Sep 23, 2011
Sold by
Heights Finance Corp Inc
Bought by
Tunstall Trust
Purchase Details
Closed on
May 29, 2008
Sold by
Zachary Scott S
Bought by
Burton Ricky G and Burton Marsha M
Home Financials for this Owner
Home Financials are based on the most recent Mortgage that was taken out on this home.
Original Mortgage
$20,126
Interest Rate
6.09%
Mortgage Type
Purchase Money Mortgage
Purchase Details
Closed on
Jan 12, 2005
Sold by
Zaclay Scott S
Bought by
Burton Ricky M and Burton Marsha M
Create a Home Valuation Report for This Property
The Home Valuation Report is an in-depth analysis detailing your home's value as well as a comparison with similar homes in the area
Home Values in the Area
Average Home Value in this Area
Purchase History
| Date | Buyer | Sale Price | Title Company |
|---|---|---|---|
| Carter Azari M | $79,900 | None Listed On Document | |
| Tunstall Trust | -- | None Available | |
| Burton Ricky G | -- | -- | |
| Burton Ricky M | $28,500 | -- |
Source: Public Records
Mortgage History
| Date | Status | Borrower | Loan Amount |
|---|---|---|---|
| Previous Owner | Burton Ricky G | $20,126 |
Source: Public Records
Tax History Compared to Growth
Tax History
| Year | Tax Paid | Tax Assessment Tax Assessment Total Assessment is a certain percentage of the fair market value that is determined by local assessors to be the total taxable value of land and additions on the property. | Land | Improvement |
|---|---|---|---|---|
| 2024 | $441 | $41,800 | $5,200 | $36,600 |
| 2023 | $401 | $37,900 | $4,900 | $33,000 |
| 2022 | $317 | $38,000 | $4,600 | $33,400 |
| 2021 | $783 | $34,800 | $4,600 | $30,200 |
| 2020 | $752 | $33,300 | $4,400 | $28,900 |
| 2019 | $735 | $32,500 | $4,400 | $28,100 |
| 2018 | $692 | $30,000 | $4,400 | $25,600 |
| 2017 | $592 | $29,600 | $4,400 | $25,200 |
| 2016 | $592 | $29,600 | $4,400 | $25,200 |
| 2014 | $592 | $29,600 | $4,400 | $25,200 |
| 2013 | $592 | $29,600 | $4,400 | $25,200 |
Source: Public Records
Map
Nearby Homes