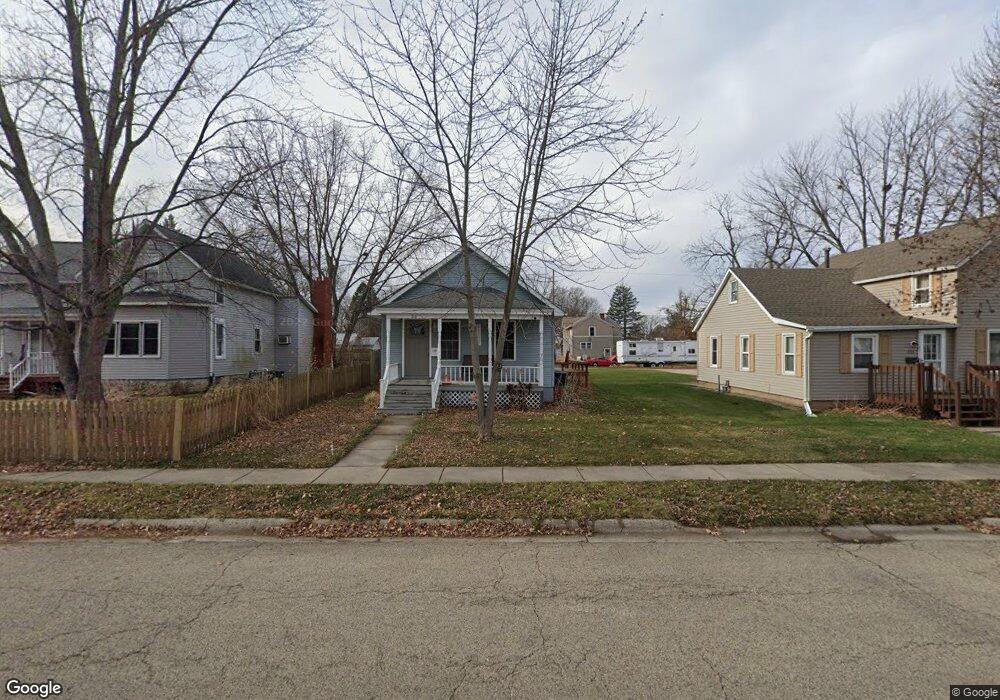
316 N 1st St Princeton, IL 61356
Estimated Value: $98,000 - $122,000
2
Beds
1
Bath
760
Sq Ft
$140/Sq Ft
Est. Value
About This Home
This home is located at 316 N 1st St, Princeton, IL 61356 and is currently estimated at $106,525, approximately $140 per square foot. 316 N 1st St is a home located in Bureau County with nearby schools including Jefferson Elementary School, Lincoln Elementary School, and Logan Junior High School.
Ownership History
Date
Name
Owned For
Owner Type
Purchase Details
Closed on
Jul 10, 2020
Sold by
Lucas Whitney B and Miller Whitney B
Bought by
Gonzalez Juan
Current Estimated Value
Home Financials for this Owner
Home Financials are based on the most recent Mortgage that was taken out on this home.
Original Mortgage
$73,131
Outstanding Balance
$64,726
Interest Rate
3%
Mortgage Type
New Conventional
Estimated Equity
$41,799
Purchase Details
Closed on
Sep 8, 2008
Sold by
Swinford Randy L
Bought by
Miller Whirney B
Home Financials for this Owner
Home Financials are based on the most recent Mortgage that was taken out on this home.
Original Mortgage
$82,480
Interest Rate
6.55%
Mortgage Type
New Conventional
Purchase Details
Closed on
Jun 5, 2007
Sold by
Citizens First National Bank
Bought by
Swinford Randy
Purchase Details
Closed on
Feb 5, 2007
Sold by
Kinnamon Kevin L
Bought by
Citizens First National Bank
Create a Home Valuation Report for This Property
The Home Valuation Report is an in-depth analysis detailing your home's value as well as a comparison with similar homes in the area
Home Values in the Area
Average Home Value in this Area
Purchase History
| Date | Buyer | Sale Price | Title Company |
|---|---|---|---|
| Gonzalez Juan | $70,000 | None Available | |
| Miller Whirney B | $79,000 | None Available | |
| Swinford Randy | $16,500 | None Available | |
| Citizens First National Bank | -- | None Available |
Source: Public Records
Mortgage History
| Date | Status | Borrower | Loan Amount |
|---|---|---|---|
| Open | Gonzalez Juan | $73,131 | |
| Previous Owner | Miller Whirney B | $82,480 | |
| Closed | Swinford Randy | $0 |
Source: Public Records
Tax History Compared to Growth
Tax History
| Year | Tax Paid | Tax Assessment Tax Assessment Total Assessment is a certain percentage of the fair market value that is determined by local assessors to be the total taxable value of land and additions on the property. | Land | Improvement |
|---|---|---|---|---|
| 2024 | $1,814 | $29,556 | $3,467 | $26,089 |
| 2023 | $1,814 | $27,220 | $3,193 | $24,027 |
| 2022 | $1,682 | $25,521 | $2,994 | $22,527 |
| 2021 | $1,616 | $24,158 | $2,834 | $21,324 |
| 2020 | $2,091 | $23,273 | $2,730 | $20,543 |
| 2019 | $2,091 | $22,994 | $2,697 | $20,297 |
| 2018 | $1,508 | $22,601 | $2,651 | $19,950 |
| 2017 | $1,536 | $22,683 | $2,661 | $20,022 |
| 2016 | $1,484 | $22,091 | $2,592 | $19,499 |
| 2015 | -- | $19,158 | $0 | $19,158 |
| 2014 | -- | $21,705 | $2,547 | $19,158 |
| 2013 | -- | $21,823 | $2,561 | $19,262 |
Source: Public Records
Map
Nearby Homes
- 225 N Randolph St
- 215 N Randolph St
- 506 N Pleasant St
- 311 W Franklin St
- 405 N Church St
- 15 S Vernon St
- 120 W Marquette St
- 103 S Plum St
- 310 S Pleasant St
- 815 W Hudson St
- 1007 W Farnham St
- 432 S 1st St
- 810 W Railroad Ave
- 443 E Peru St
- 1203 W Clark St
- 525 E Marion St
- 725 Independence Dr
- 1322 W Peru St
- 804 S Euclid Ave
- 836 Park Ave W