Estimated Value: $337,000 - $441,611
--
Bed
--
Bath
--
Sq Ft
10,454
Sq Ft Lot
About This Home
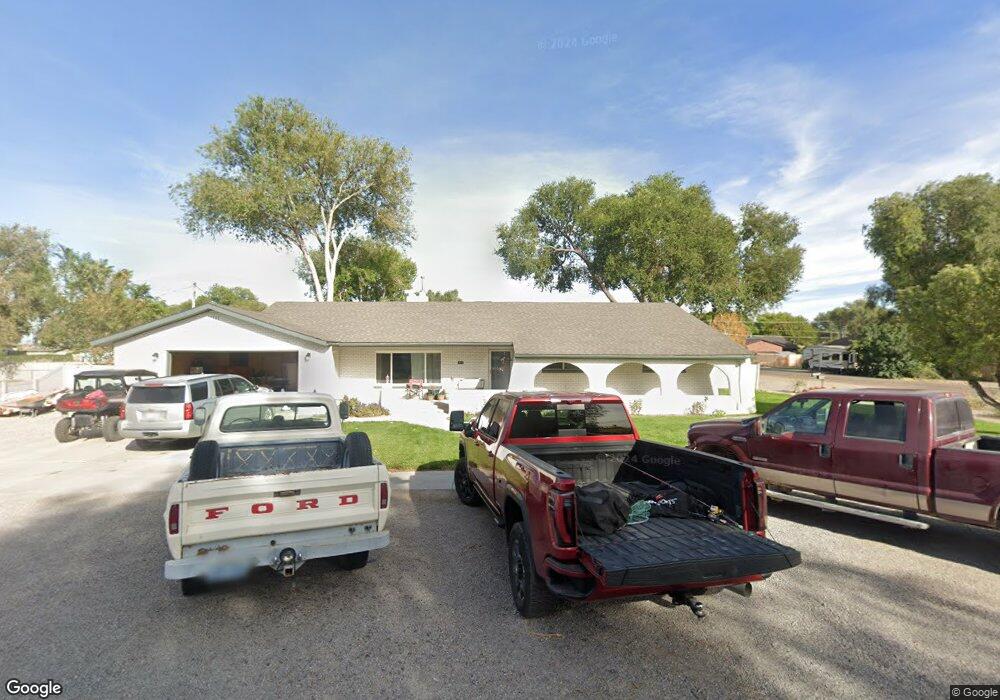
This home is located at 316 N 200 W, Delta, UT 84624 and is currently estimated at $385,653. 316 N 200 W is a home with nearby schools including Cba Center and White River Academy.
Ownership History
Date
Name
Owned For
Owner Type
Purchase Details
Closed on
Jul 21, 2020
Sold by
Droubay Chad R and Droubay Whitney R
Bought by
Dyer Courtney and Dyer Dale
Current Estimated Value
Purchase Details
Closed on
Jul 2, 2007
Sold by
Allen Louise R and Allen David R
Bought by
Allen Louise E
Home Financials for this Owner
Home Financials are based on the most recent Mortgage that was taken out on this home.
Original Mortgage
$146,585
Interest Rate
6.41%
Mortgage Type
New Conventional
Purchase Details
Closed on
Jun 29, 2007
Sold by
Allen Louise R
Bought by
Droubay Chad R and Droubay Whitney R
Home Financials for this Owner
Home Financials are based on the most recent Mortgage that was taken out on this home.
Original Mortgage
$146,585
Interest Rate
6.41%
Mortgage Type
New Conventional
Create a Home Valuation Report for This Property
The Home Valuation Report is an in-depth analysis detailing your home's value as well as a comparison with similar homes in the area
Home Values in the Area
Average Home Value in this Area
Purchase History
| Date | Buyer | Sale Price | Title Company |
|---|---|---|---|
| Dyer Courtney | -- | None Available | |
| Allen Louise E | -- | -- | |
| Droubay Chad R | -- | -- |
Source: Public Records
Mortgage History
| Date | Status | Borrower | Loan Amount |
|---|---|---|---|
| Previous Owner | Allen Louise E | $146,585 | |
| Previous Owner | Droubay Chad R | $146,585 |
Source: Public Records
Tax History Compared to Growth
Tax History
| Year | Tax Paid | Tax Assessment Tax Assessment Total Assessment is a certain percentage of the fair market value that is determined by local assessors to be the total taxable value of land and additions on the property. | Land | Improvement |
|---|---|---|---|---|
| 2025 | $2,279 | $243,803 | $16,379 | $227,424 |
| 2024 | $2,279 | $211,728 | $12,336 | $199,392 |
| 2023 | $2,600 | $211,728 | $12,336 | $199,392 |
| 2022 | $2,013 | $151,497 | $12,896 | $138,601 |
| 2021 | $1,706 | $122,563 | $9,752 | $112,811 |
| 2020 | $1,589 | $113,450 | $8,865 | $104,585 |
| 2019 | $1,533 | $109,567 | $8,209 | $101,358 |
| 2018 | $1,405 | $101,198 | $8,209 | $92,989 |
| 2017 | $1,455 | $100,959 | $7,970 | $92,989 |
| 2016 | $1,410 | $100,959 | $7,970 | $92,989 |
| 2015 | $1,410 | $100,959 | $7,970 | $92,989 |
| 2014 | -- | $96,629 | $7,970 | $88,659 |
| 2013 | -- | $96,629 | $7,970 | $88,659 |
Source: Public Records
Map
Nearby Homes