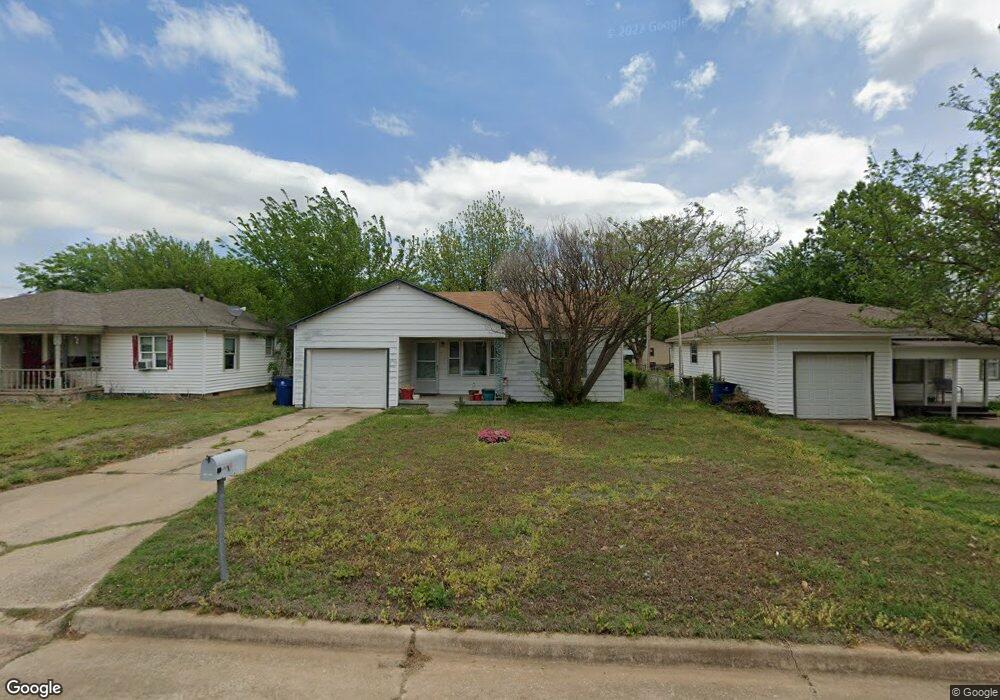
316 N G St Duncan, OK 73533
Estimated Value: $50,965 - $58,000
2
Beds
1
Bath
934
Sq Ft
$58/Sq Ft
Est. Value
About This Home
This home is located at 316 N G St, Duncan, OK 73533 and is currently estimated at $53,991, approximately $57 per square foot. 316 N G St is a home located in Stephens County with nearby schools including Woodrow Wilson Elementary School, Duncan Middle School, and Duncan High School.
Ownership History
Date
Name
Owned For
Owner Type
Purchase Details
Closed on
Nov 14, 2014
Sold by
Traux Travis K and Traux Shannon L
Bought by
Owens Jr Johnny James and Owens Sr Johnny J
Current Estimated Value
Purchase Details
Closed on
Apr 17, 2013
Sold by
Contreras Florencio
Bought by
Truax Shamon L and Truax Travis K
Purchase Details
Closed on
Sep 20, 1993
Sold by
Roberson Carlos C
Create a Home Valuation Report for This Property
The Home Valuation Report is an in-depth analysis detailing your home's value as well as a comparison with similar homes in the area
Purchase History
| Date | Buyer | Sale Price | Title Company |
|---|---|---|---|
| Owens Jr Johnny James | $25,000 | None Available | |
| Truax Shamon L | -- | None Available | |
| -- | -- | -- |
Source: Public Records
Tax History
| Year | Tax Paid | Tax Assessment Tax Assessment Total Assessment is a certain percentage of the fair market value that is determined by local assessors to be the total taxable value of land and additions on the property. | Land | Improvement |
|---|---|---|---|---|
| 2025 | $323 | $3,829 | $341 | $3,488 |
| 2024 | $296 | $3,473 | $341 | $3,132 |
| 2023 | $296 | $3,473 | $341 | $3,132 |
| 2022 | $268 | $3,308 | $341 | $2,967 |
| 2021 | $268 | $3,150 | $341 | $2,809 |
| 2020 | $247 | $2,858 | $341 | $2,517 |
| 2019 | $240 | $2,778 | $341 | $2,437 |
| 2018 | $270 | $3,029 | $341 | $2,688 |
| 2017 | $258 | $3,115 | $341 | $2,774 |
| 2016 | $243 | $2,855 | $341 | $2,514 |
| 2015 | $293 | $2,855 | $341 | $2,514 |
| 2014 | $293 | $3,245 | $330 | $2,915 |
Source: Public Records
Map
Nearby Homes
Your Personal Tour Guide
Ask me questions while you tour the home.