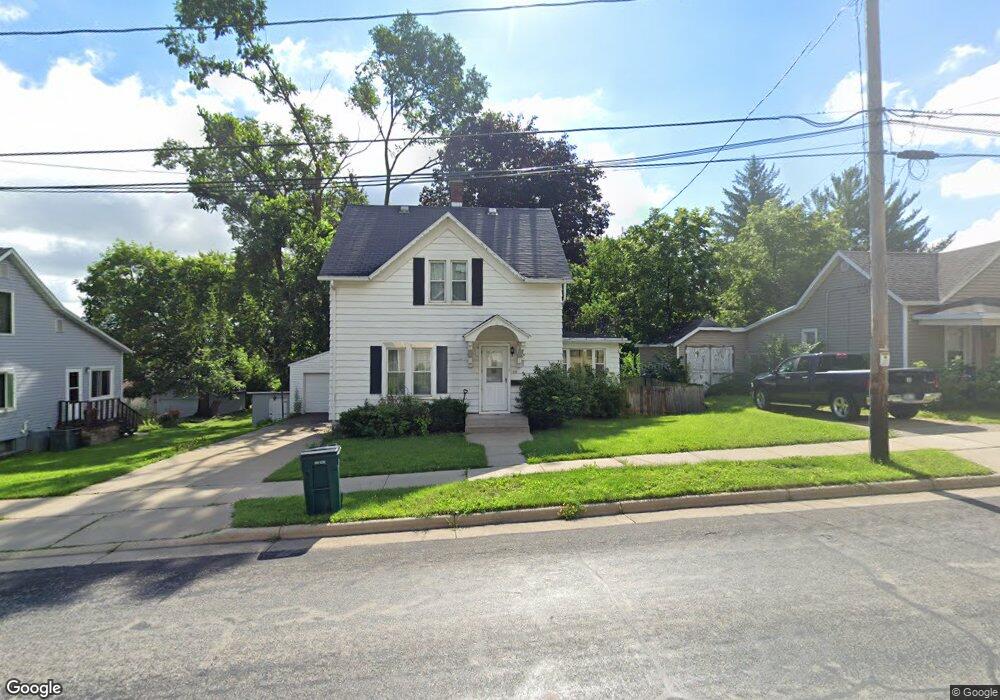
316 N High St Fort Atkinson, WI 53538
Estimated Value: $225,000 - $283,000
3
Beds
1
Bath
1,272
Sq Ft
$194/Sq Ft
Est. Value
About This Home
This home is located at 316 N High St, Fort Atkinson, WI 53538 and is currently estimated at $246,194, approximately $193 per square foot. 316 N High St is a home located in Jefferson County with nearby schools including Purdy Elementary School, Fort Atkinson Middle School, and Fort Atkinson High School.
Ownership History
Date
Name
Owned For
Owner Type
Purchase Details
Closed on
Jun 27, 2008
Sold by
Lange Diane K and Munns Roger E
Bought by
Dortch Ami D
Current Estimated Value
Home Financials for this Owner
Home Financials are based on the most recent Mortgage that was taken out on this home.
Original Mortgage
$138,200
Outstanding Balance
$89,066
Interest Rate
6.05%
Mortgage Type
New Conventional
Estimated Equity
$157,128
Create a Home Valuation Report for This Property
The Home Valuation Report is an in-depth analysis detailing your home's value as well as a comparison with similar homes in the area
Home Values in the Area
Average Home Value in this Area
Purchase History
| Date | Buyer | Sale Price | Title Company |
|---|---|---|---|
| Dortch Ami D | $133,500 | None Available |
Source: Public Records
Mortgage History
| Date | Status | Borrower | Loan Amount |
|---|---|---|---|
| Open | Dortch Ami D | $138,200 |
Source: Public Records
Tax History Compared to Growth
Tax History
| Year | Tax Paid | Tax Assessment Tax Assessment Total Assessment is a certain percentage of the fair market value that is determined by local assessors to be the total taxable value of land and additions on the property. | Land | Improvement |
|---|---|---|---|---|
| 2024 | $2,411 | $131,000 | $37,500 | $93,500 |
| 2023 | $2,066 | $131,000 | $37,500 | $93,500 |
| 2022 | $1,934 | $81,800 | $25,500 | $56,300 |
| 2021 | $1,697 | $81,800 | $25,500 | $56,300 |
| 2020 | $1,711 | $81,800 | $25,500 | $56,300 |
| 2019 | $1,621 | $81,800 | $25,500 | $56,300 |
| 2018 | $1,575 | $81,800 | $25,500 | $56,300 |
| 2017 | $1,574 | $81,800 | $25,500 | $56,300 |
| 2016 | $2,664 | $127,700 | $23,700 | $104,000 |
| 2015 | $2,787 | $127,700 | $23,700 | $104,000 |
| 2014 | $2,692 | $127,700 | $23,700 | $104,000 |
| 2013 | $2,763 | $127,700 | $23,700 | $104,000 |
Source: Public Records
Map
Nearby Homes
- 416 N 3rd St
- 426 Jefferson St
- 311 N Main St
- 702 Florence St
- 233 S Water St E
- 707 N Fourth St
- 520 Edward St
- 234 S Main St
- 214 Hickory St
- 125 Monroe St
- 336 Jones Ave
- 715 Madison Ave
- 605 Nelson St
- 916 Madison Ave
- 609 Cloute St
- 845 Messmer St
- N2482 Rock River Rd
- 1120 Van Buren St
- 42 Wilson Ave
- 1112 Menomonee Ct