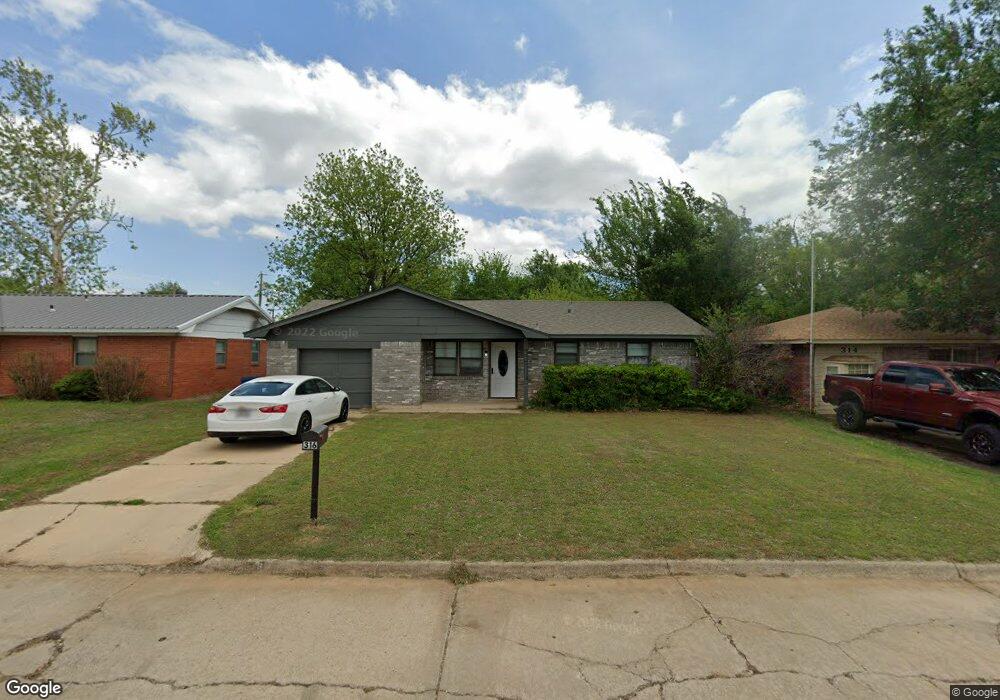
316 N I St Duncan, OK 73533
Estimated Value: $60,000 - $123,000
3
Beds
2
Baths
1,115
Sq Ft
$77/Sq Ft
Est. Value
About This Home
This home is located at 316 N I St, Duncan, OK 73533 and is currently estimated at $86,211, approximately $77 per square foot. 316 N I St is a home located in Stephens County with nearby schools including Woodrow Wilson Elementary School, Duncan Middle School, and Duncan High School.
Ownership History
Date
Name
Owned For
Owner Type
Purchase Details
Closed on
Apr 5, 2024
Sold by
Headley Jeremy and Headley Jami
Bought by
Morgan Ashley Marie
Current Estimated Value
Home Financials for this Owner
Home Financials are based on the most recent Mortgage that was taken out on this home.
Original Mortgage
$108,007
Outstanding Balance
$106,300
Interest Rate
6.9%
Mortgage Type
FHA
Estimated Equity
-$20,089
Purchase Details
Closed on
Nov 13, 2019
Sold by
Raska Christopher Gerard and Smith Raska Sue Anne
Bought by
Headley Jeremy and Headley Jami
Purchase Details
Closed on
Mar 31, 2014
Sold by
Raska Sue Smith
Bought by
Raska Christopher Gerard
Purchase Details
Closed on
Jun 2, 1992
Sold by
Raska Robin Lea
Create a Home Valuation Report for This Property
The Home Valuation Report is an in-depth analysis detailing your home's value as well as a comparison with similar homes in the area
Home Values in the Area
Average Home Value in this Area
Purchase History
| Date | Buyer | Sale Price | Title Company |
|---|---|---|---|
| Morgan Ashley Marie | $110,000 | First American Title | |
| Headley Jeremy | $15,000 | Stephens Co Abstract Co | |
| Raska Christopher Gerard | -- | None Available | |
| -- | -- | -- |
Source: Public Records
Mortgage History
| Date | Status | Borrower | Loan Amount |
|---|---|---|---|
| Open | Morgan Ashley Marie | $108,007 |
Source: Public Records
Tax History Compared to Growth
Tax History
| Year | Tax Paid | Tax Assessment Tax Assessment Total Assessment is a certain percentage of the fair market value that is determined by local assessors to be the total taxable value of land and additions on the property. | Land | Improvement |
|---|---|---|---|---|
| 2025 | $1,044 | $12,369 | $437 | $11,932 |
| 2024 | $179 | $2,102 | $437 | $1,665 |
| 2023 | $179 | $2,103 | $437 | $1,666 |
| 2022 | $162 | $2,002 | $437 | $1,565 |
| 2021 | $162 | $1,907 | $437 | $1,470 |
| 2020 | $149 | $1,730 | $437 | $1,293 |
| 2019 | $321 | $3,710 | $437 | $3,273 |
| 2018 | $486 | $5,461 | $437 | $5,024 |
| 2017 | $480 | $5,871 | $421 | $5,450 |
| 2016 | $453 | $5,326 | $387 | $4,939 |
| 2015 | $384 | $5,072 | $380 | $4,692 |
| 2014 | $384 | $4,831 | $374 | $4,457 |
Source: Public Records
Map
Nearby Homes