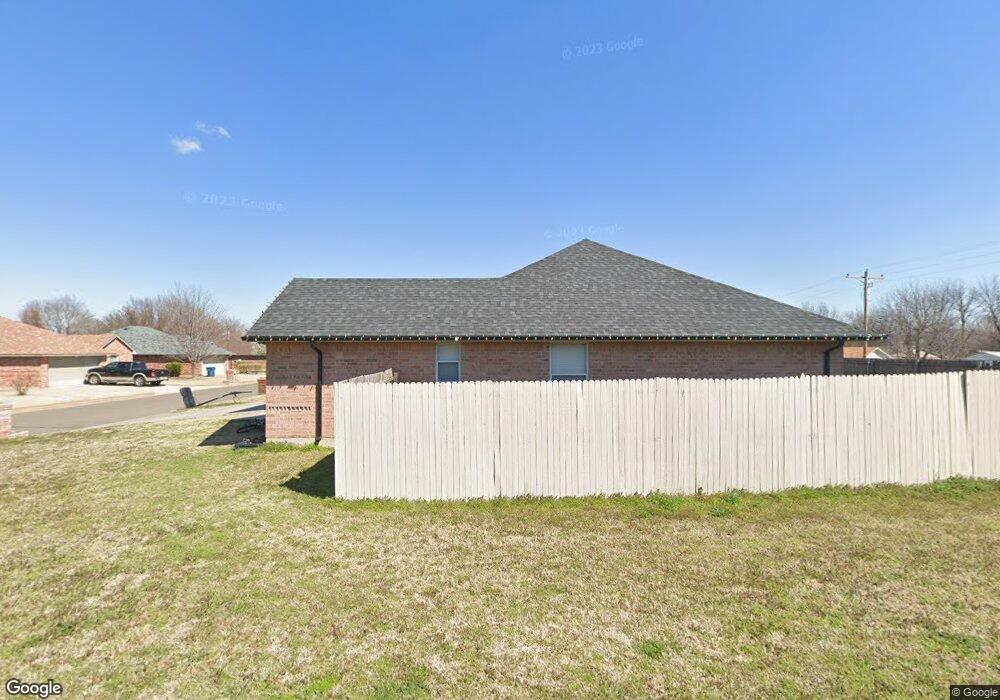
316 NE 9th Place Newcastle, OK 73065
Estimated Value: $196,000 - $214,000
3
Beds
2
Baths
1,295
Sq Ft
$157/Sq Ft
Est. Value
About This Home
This home is located at 316 NE 9th Place, Newcastle, OK 73065 and is currently estimated at $203,108, approximately $156 per square foot. 316 NE 9th Place is a home with nearby schools including Newcastle Elementary School, Newcastle Middle School, and Newcastle High School.
Ownership History
Date
Name
Owned For
Owner Type
Purchase Details
Closed on
Jun 10, 2022
Sold by
Alan Ross Ii Richard
Bought by
Rr Jr Revocable Trust
Current Estimated Value
Purchase Details
Closed on
Oct 17, 2016
Sold by
Singleteary Brad Lee and Singleteary Marci
Bought by
Ross Richard
Home Financials for this Owner
Home Financials are based on the most recent Mortgage that was taken out on this home.
Original Mortgage
$97,500
Interest Rate
3.46%
Mortgage Type
New Conventional
Purchase Details
Closed on
Jul 14, 2016
Sold by
Us Bank Na
Bought by
Singleteary Brad Lee
Purchase Details
Closed on
Apr 6, 2016
Sold by
Mason Charles Lee and Mason Amy C
Bought by
U S Bank N A
Purchase Details
Closed on
Apr 8, 2005
Sold by
Fleenor Enterprises Inc
Bought by
Mason Charles Lee and Mason Amy C
Home Financials for this Owner
Home Financials are based on the most recent Mortgage that was taken out on this home.
Original Mortgage
$101,777
Interest Rate
5.89%
Mortgage Type
FHA
Create a Home Valuation Report for This Property
The Home Valuation Report is an in-depth analysis detailing your home's value as well as a comparison with similar homes in the area
Home Values in the Area
Average Home Value in this Area
Purchase History
| Date | Buyer | Sale Price | Title Company |
|---|---|---|---|
| Rr Jr Revocable Trust | -- | None Listed On Document | |
| Ross Richard | $130,000 | None Available | |
| Singleteary Brad Lee | $94,199 | Linear Title & Closing | |
| U S Bank N A | $115,773 | None Available | |
| Mason Charles Lee | $103,000 | None Available |
Source: Public Records
Mortgage History
| Date | Status | Borrower | Loan Amount |
|---|---|---|---|
| Previous Owner | Ross Richard | $97,500 | |
| Previous Owner | Mason Charles Lee | $101,777 |
Source: Public Records
Tax History Compared to Growth
Tax History
| Year | Tax Paid | Tax Assessment Tax Assessment Total Assessment is a certain percentage of the fair market value that is determined by local assessors to be the total taxable value of land and additions on the property. | Land | Improvement |
|---|---|---|---|---|
| 2025 | $1,879 | $17,207 | $3,300 | $13,907 |
| 2024 | $1,879 | $16,388 | $3,300 | $13,088 |
| 2023 | $1,879 | $15,607 | $3,300 | $12,307 |
| 2022 | $1,802 | $15,607 | $3,300 | $12,307 |
| 2021 | $1,890 | $15,607 | $3,300 | $12,307 |
| 2020 | $1,898 | $15,607 | $3,300 | $12,307 |
| 2019 | $1,874 | $15,176 | $3,300 | $11,876 |
| 2018 | $1,826 | $15,015 | $3,300 | $11,715 |
| 2017 | $1,735 | $14,300 | $3,300 | $11,000 |
| 2016 | $1,549 | $12,713 | $2,936 | $9,777 |
| 2015 | $1,475 | $12,107 | $1,650 | $10,457 |
| 2014 | $1,387 | $11,531 | $1,650 | $9,881 |
Source: Public Records
Map
Nearby Homes
- 375 NE 9th Place
- 303 Naomi Ln
- 1013 N Carr Dr
- 1100 N Doris Ave
- 1109 N Doris Ave
- 2 S Main St
- 3 S Main St
- 1 S Main St
- 4 S Main St
- 5 S Main St
- 6 S Main St
- 820 NW 5th St
- 908 NW 6th St
- 551 SE 4th St
- 1009 NW 5th St
- 1012 NW 5th St
- 808 Saint James Place
- 501 Saint James Place
- 1657 Autumn Lane Ct
- 410 NE 17th Place
- 322 NE 9th Place
- 283 NE 9th Place
- 334 NE 9th Place
- 319 NE 9th Place
- 295 NE 9th Place
- 307 NE 9th Place
- 295 NE 9th Place
- 325 NE 9th Place
- 202 NE 9th St
- 301 NE 9th Place
- 333 NE 9th Place
- 342 NE 9th Place
- 122 NE 9th St
- 0 NE 9th St
- 222 NE 9th St
- 347 NE 9th Place
- 304 NE 10th St
- 356 NE 9th Place
- 308 NE 10th St
- 300 NE 10th St