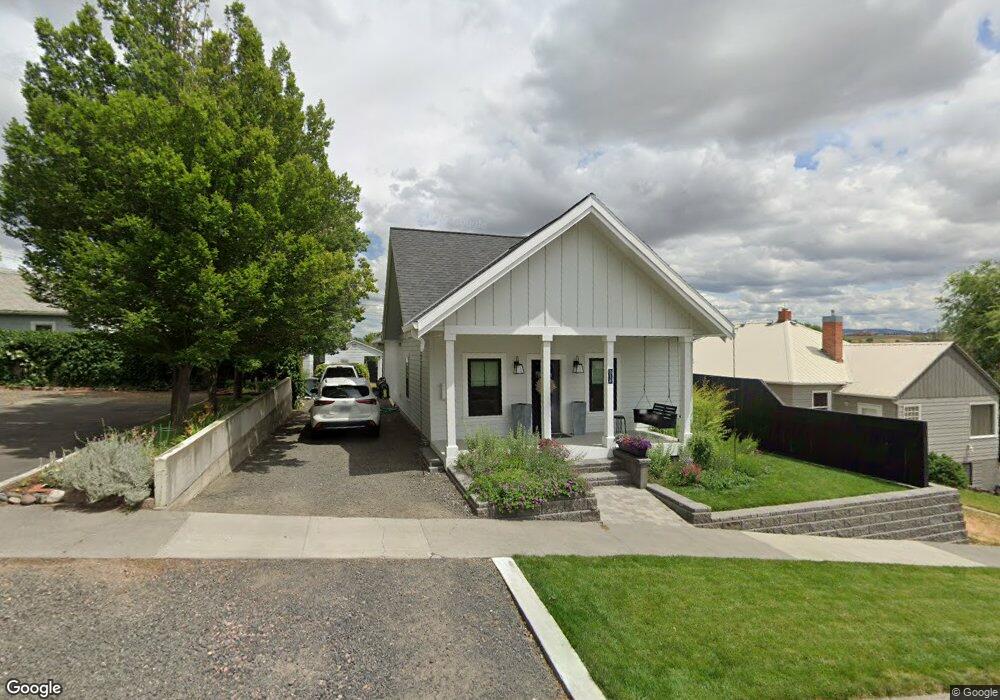
316 NW 11th St Pendleton, OR 97801
Estimated Value: $274,000 - $334,000
2
Beds
1
Bath
832
Sq Ft
$360/Sq Ft
Est. Value
About This Home
This home is located at 316 NW 11th St, Pendleton, OR 97801 and is currently estimated at $299,674, approximately $360 per square foot. 316 NW 11th St is a home located in Umatilla County with nearby schools including Washington Elementary School, Sunridge Middle School, and Pendleton High School.
Ownership History
Date
Name
Owned For
Owner Type
Purchase Details
Closed on
Apr 24, 2025
Sold by
Allen Jane
Bought by
Sescleifer Cynthia M
Current Estimated Value
Purchase Details
Closed on
Dec 16, 2016
Sold by
Jordan Mona
Bought by
Beard Casey F and Beard Anne
Purchase Details
Closed on
Feb 17, 2010
Sold by
Homesales Inc
Bought by
Jordan Mona
Home Financials for this Owner
Home Financials are based on the most recent Mortgage that was taken out on this home.
Original Mortgage
$84,080
Interest Rate
5.02%
Mortgage Type
New Conventional
Purchase Details
Closed on
Oct 5, 2009
Sold by
Helfrecht Stephanie D
Bought by
Homesales Inc
Purchase Details
Closed on
Apr 19, 2007
Sold by
Patton Melissa L and Hulse Melissa L
Bought by
Helfrecht Stephanie
Home Financials for this Owner
Home Financials are based on the most recent Mortgage that was taken out on this home.
Original Mortgage
$88,070
Interest Rate
6.15%
Mortgage Type
New Conventional
Create a Home Valuation Report for This Property
The Home Valuation Report is an in-depth analysis detailing your home's value as well as a comparison with similar homes in the area
Home Values in the Area
Average Home Value in this Area
Purchase History
| Date | Buyer | Sale Price | Title Company |
|---|---|---|---|
| Sescleifer Cynthia M | -- | None Listed On Document | |
| Beard Casey F | $70,000 | Amerititle | |
| Jordan Mona | $80,000 | Amerititle | |
| Homesales Inc | $70,715 | Pioneer Title Co | |
| Helfrecht Stephanie | $78,500 | Amerititle |
Source: Public Records
Mortgage History
| Date | Status | Borrower | Loan Amount |
|---|---|---|---|
| Previous Owner | Jordan Mona | $84,080 | |
| Previous Owner | Helfrecht Stephanie | $88,070 |
Source: Public Records
Tax History
| Year | Tax Paid | Tax Assessment Tax Assessment Total Assessment is a certain percentage of the fair market value that is determined by local assessors to be the total taxable value of land and additions on the property. | Land | Improvement |
|---|---|---|---|---|
| 2022 | $2,663 | $147,230 | $0 | $0 |
| 2021 | $2,679 | $142,950 | $35,690 | $107,260 |
| 2020 | $2,587 | $138,790 | $34,650 | $104,140 |
| 2018 | $628 | $32,670 | $32,670 | $0 |
| 2017 | $1,236 | $64,010 | $31,720 | $32,290 |
| 2016 | $1,168 | $62,150 | $30,790 | $31,360 |
| 2015 | $1,169 | $56,890 | $28,190 | $28,700 |
| 2014 | $1,119 | $56,890 | $28,190 | $28,700 |
Source: Public Records
Map
Nearby Homes
- 312 NW 11th St
- 1018 NW Ellis Ave
- 1012 NW Ellis Ave
- 315 NW 10th St
- 1010 NW Ellis Ave
- 1011 NW Despain Ave
- 1015 NW Despain Ave
- 319 NW 11th St
- 311 NW 11th St
- 1004 NW Ellis Ave
- 323 NW 11th St
- 1103 NW Despain Ave
- 414 NW 11th St
- 1013 NW Ellis Ave
- 1015 NW Ellis Ave
- 312 NW 10th St
- 316 NW 10th St
- 401 NW 11th St
- 315 NW 9th St
- 1012 NW Despain Ave
Your Personal Tour Guide
Ask me questions while you tour the home.