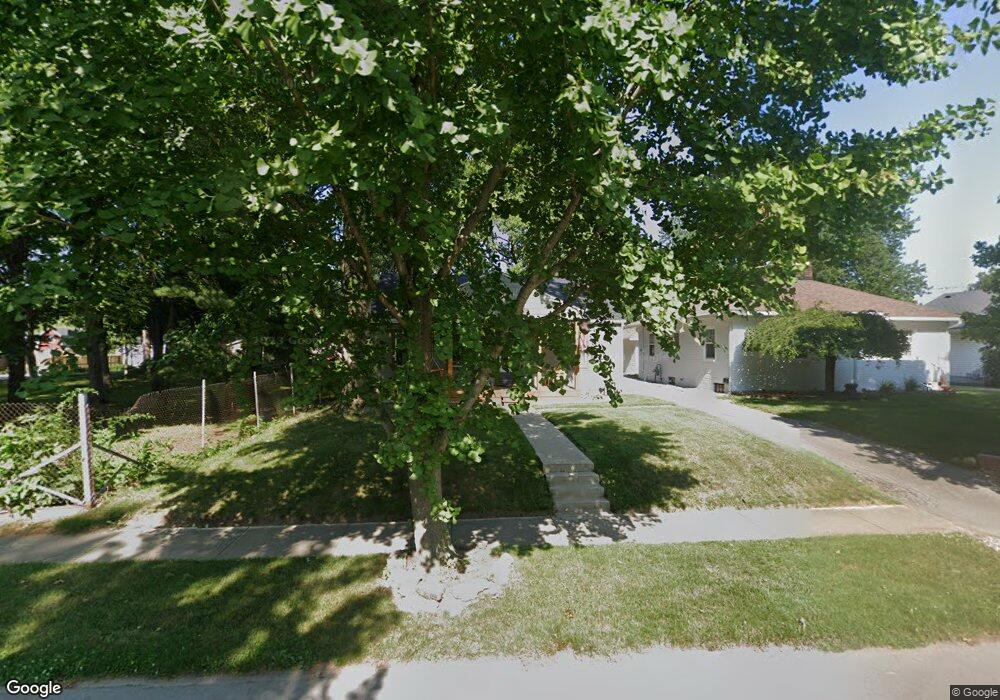
316 Pearl St Pendleton, IN 46064
Estimated Value: $216,000 - $343,000
2
Beds
1
Bath
1,056
Sq Ft
$247/Sq Ft
Est. Value
About This Home
This home is located at 316 Pearl St, Pendleton, IN 46064 and is currently estimated at $260,407, approximately $246 per square foot. 316 Pearl St is a home located in Madison County with nearby schools including Pendleton Elementary School and Pendleton Heights Middle School.
Ownership History
Date
Name
Owned For
Owner Type
Purchase Details
Closed on
Oct 15, 2018
Sold by
Ronk Chris P
Bought by
Fleetwood Randy R and Fleetwood Julia A
Current Estimated Value
Home Financials for this Owner
Home Financials are based on the most recent Mortgage that was taken out on this home.
Original Mortgage
$170,500
Outstanding Balance
$148,396
Interest Rate
4.6%
Mortgage Type
Adjustable Rate Mortgage/ARM
Estimated Equity
$112,011
Create a Home Valuation Report for This Property
The Home Valuation Report is an in-depth analysis detailing your home's value as well as a comparison with similar homes in the area
Home Values in the Area
Average Home Value in this Area
Purchase History
| Date | Buyer | Sale Price | Title Company |
|---|---|---|---|
| Fleetwood Randy R | -- | Security Title |
Source: Public Records
Mortgage History
| Date | Status | Borrower | Loan Amount |
|---|---|---|---|
| Open | Fleetwood Randy R | $170,500 |
Source: Public Records
Tax History
| Year | Tax Paid | Tax Assessment Tax Assessment Total Assessment is a certain percentage of the fair market value that is determined by local assessors to be the total taxable value of land and additions on the property. | Land | Improvement |
|---|---|---|---|---|
| 2025 | $1,092 | $132,000 | $26,700 | $105,300 |
| 2024 | $1,092 | $125,300 | $26,700 | $98,600 |
| 2023 | $1,064 | $116,100 | $25,400 | $90,700 |
| 2022 | $1,077 | $120,000 | $24,200 | $95,800 |
| 2021 | $962 | $111,700 | $24,200 | $87,500 |
| 2020 | $1,108 | $108,700 | $23,100 | $85,600 |
| 2019 | $963 | $106,100 | $23,100 | $83,000 |
| 2018 | $878 | $99,100 | $23,100 | $76,000 |
| 2017 | $770 | $91,200 | $21,300 | $69,900 |
| 2016 | $769 | $91,200 | $21,300 | $69,900 |
| 2014 | $789 | $91,800 | $21,300 | $70,500 |
| 2013 | $789 | $91,800 | $21,300 | $70,500 |
Source: Public Records
Map
Nearby Homes
- 460 E Madison Ave
- 621 S Silver St
- 315 W High St
- 644 Center St
- 110 W Water St
- 720 S Broadway St
- 1000 East St
- 319 Jefferson St
- 513 W State St
- 238 Jefferson St
- 9806 Olympic Blvd
- 637 Kilmore Dr
- 7160 Murph Way
- 9835 Bryce Blvd
- 9909 Canyon Ln
- 6972 S 300 W
- 0 W State St
- 3006 Huntsville Rd
- 296 Evening Bay Ct
- 1485 Bella Rita Ln
Your Personal Tour Guide
Ask me questions while you tour the home.