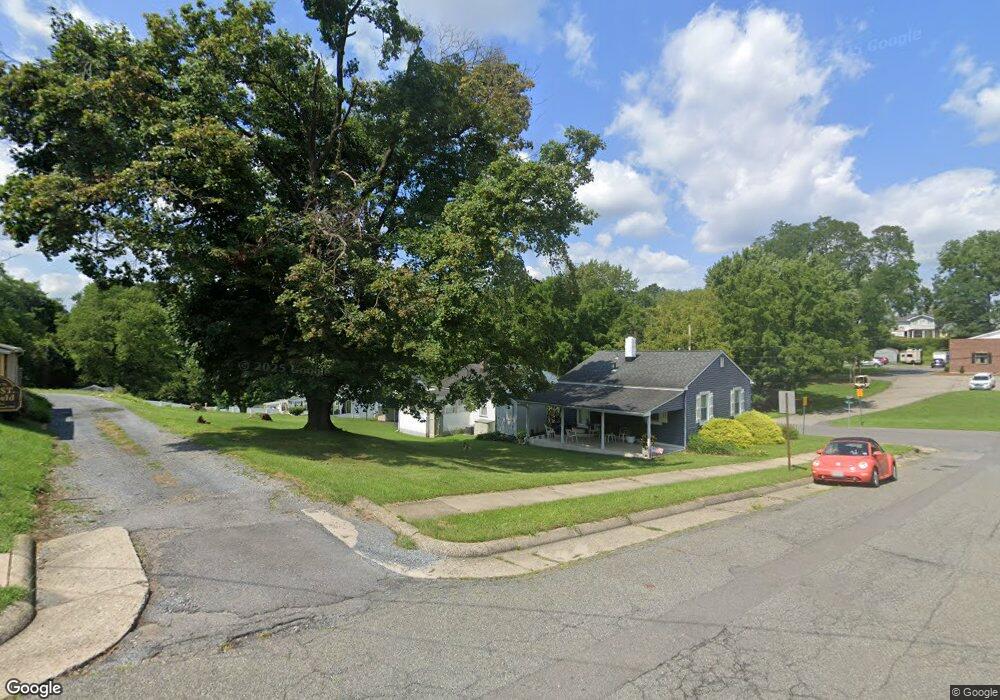
316 Pursel St Phillipsburg, NJ 08865
Estimated Value: $222,961 - $272,000
--
Bed
--
Bath
624
Sq Ft
$403/Sq Ft
Est. Value
About This Home
This home is located at 316 Pursel St, Phillipsburg, NJ 08865 and is currently estimated at $251,240, approximately $402 per square foot. 316 Pursel St is a home located in Warren County with nearby schools including Phillipsburg High School, Easton Arts Academy Elementary Cs, and Sts. Philip & James School.
Ownership History
Date
Name
Owned For
Owner Type
Purchase Details
Closed on
Jan 27, 2005
Sold by
Ruch Sterling W
Bought by
Beidelman Mark W
Current Estimated Value
Home Financials for this Owner
Home Financials are based on the most recent Mortgage that was taken out on this home.
Original Mortgage
$100,350
Outstanding Balance
$50,738
Interest Rate
5.67%
Mortgage Type
FHA
Estimated Equity
$200,502
Purchase Details
Closed on
Nov 6, 1995
Sold by
Ruch Sterling W
Bought by
Ruch Sterling W
Create a Home Valuation Report for This Property
The Home Valuation Report is an in-depth analysis detailing your home's value as well as a comparison with similar homes in the area
Home Values in the Area
Average Home Value in this Area
Purchase History
| Date | Buyer | Sale Price | Title Company |
|---|---|---|---|
| Beidelman Mark W | $102,000 | Fidelity Natl Title Ins Co | |
| Ruch Sterling W | -- | -- |
Source: Public Records
Mortgage History
| Date | Status | Borrower | Loan Amount |
|---|---|---|---|
| Open | Beidelman Mark W | $100,350 |
Source: Public Records
Tax History Compared to Growth
Tax History
| Year | Tax Paid | Tax Assessment Tax Assessment Total Assessment is a certain percentage of the fair market value that is determined by local assessors to be the total taxable value of land and additions on the property. | Land | Improvement |
|---|---|---|---|---|
| 2025 | $4,172 | $91,800 | $34,500 | $57,300 |
| 2024 | $3,852 | $91,800 | $34,500 | $57,300 |
| 2023 | $3,808 | $91,800 | $34,500 | $57,300 |
| 2022 | $3,808 | $91,800 | $34,500 | $57,300 |
| 2021 | $3,686 | $91,800 | $34,500 | $57,300 |
| 2020 | $3,711 | $91,800 | $34,500 | $57,300 |
| 2019 | $3,655 | $91,800 | $34,500 | $57,300 |
| 2018 | $3,655 | $91,800 | $34,500 | $57,300 |
| 2017 | $3,638 | $91,800 | $34,500 | $57,300 |
| 2016 | $3,582 | $91,800 | $34,500 | $57,300 |
| 2015 | $3,555 | $91,800 | $34,500 | $57,300 |
| 2014 | $3,439 | $91,800 | $34,500 | $57,300 |
Source: Public Records
Map
Nearby Homes