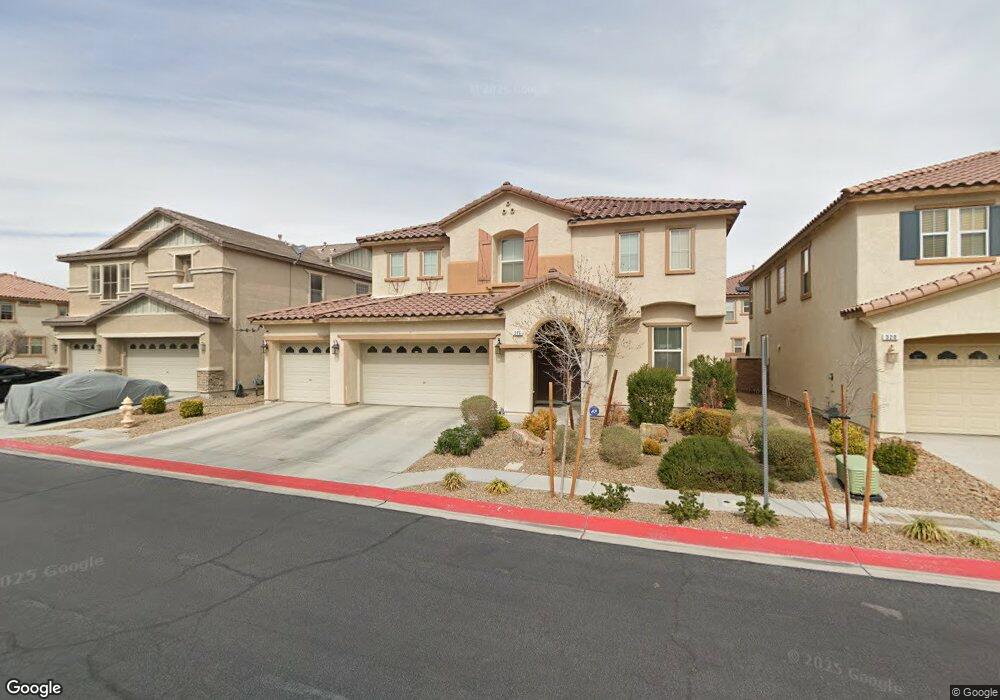
316 Raptors View Ave North Las Vegas, NV 89031
Craig Ranch NeighborhoodEstimated Value: $480,948 - $508,000
4
Beds
3
Baths
2,825
Sq Ft
$176/Sq Ft
Est. Value
About This Home
This home is located at 316 Raptors View Ave, North Las Vegas, NV 89031 and is currently estimated at $498,487, approximately $176 per square foot. 316 Raptors View Ave is a home located in Clark County with nearby schools including Fredric W. Watson Elementary School, Clifford O. Findlay Middle School, and Legacy High School.
Ownership History
Date
Name
Owned For
Owner Type
Purchase Details
Closed on
Mar 5, 2008
Sold by
Us Bank Na
Bought by
Ramirez Jesus A
Current Estimated Value
Home Financials for this Owner
Home Financials are based on the most recent Mortgage that was taken out on this home.
Original Mortgage
$260,905
Outstanding Balance
$162,365
Interest Rate
5.72%
Mortgage Type
FHA
Estimated Equity
$336,122
Purchase Details
Closed on
Jul 3, 2007
Sold by
Carlson Rick
Bought by
Us Bank Na
Purchase Details
Closed on
Apr 28, 2006
Sold by
Carlson Debra
Bought by
Carlson Rick
Home Financials for this Owner
Home Financials are based on the most recent Mortgage that was taken out on this home.
Original Mortgage
$319,400
Interest Rate
8%
Mortgage Type
Unknown
Purchase Details
Closed on
Oct 12, 2005
Sold by
Hearthstone Multi Asset Entity B Lp
Bought by
Kb Home Nevada Inc
Create a Home Valuation Report for This Property
The Home Valuation Report is an in-depth analysis detailing your home's value as well as a comparison with similar homes in the area
Home Values in the Area
Average Home Value in this Area
Purchase History
| Date | Buyer | Sale Price | Title Company |
|---|---|---|---|
| Ramirez Jesus A | $265,000 | Fidelity National Title | |
| Us Bank Na | $297,020 | Fidelity National Title Agen | |
| Carlson Rick | -- | First Amer Title Co Of Nv | |
| Carlson Rick | $399,251 | First Amer Title Co Of Nv | |
| Kb Home Nevada Inc | $1,442,800 | First Amer Title Co Of Nv |
Source: Public Records
Mortgage History
| Date | Status | Borrower | Loan Amount |
|---|---|---|---|
| Open | Ramirez Jesus A | $260,905 | |
| Previous Owner | Carlson Rick | $319,400 |
Source: Public Records
Tax History Compared to Growth
Tax History
| Year | Tax Paid | Tax Assessment Tax Assessment Total Assessment is a certain percentage of the fair market value that is determined by local assessors to be the total taxable value of land and additions on the property. | Land | Improvement |
|---|---|---|---|---|
| 2025 | $2,698 | $145,682 | $40,600 | $105,082 |
| 2024 | $2,499 | $145,682 | $40,600 | $105,082 |
| 2023 | $2,499 | $149,056 | $41,650 | $107,406 |
| 2022 | $2,314 | $114,527 | $32,200 | $82,327 |
| 2021 | $2,143 | $108,137 | $26,600 | $81,537 |
| 2020 | $1,987 | $106,182 | $27,300 | $78,882 |
| 2019 | $1,862 | $94,200 | $25,550 | $68,650 |
| 2018 | $1,777 | $84,032 | $20,300 | $63,732 |
| 2017 | $2,598 | $77,372 | $16,450 | $60,922 |
| 2016 | $1,664 | $61,391 | $12,250 | $49,141 |
| 2015 | $1,660 | $53,620 | $11,200 | $42,420 |
| 2014 | $1,608 | $46,438 | $8,750 | $37,688 |
Source: Public Records
Map
Nearby Homes
- 305 Snow Dome Ave
- 5908 Big Horn View St
- 5824 Gemstone Peak St
- 209 Copper Pine Ave
- 5929 Caddy Ridge St
- 104 Big Cliff Ave
- 12 Copper Pine Ave
- 5929 Pink Chaff St
- 709 Brown Breeches Ave
- 5709 Jaysin Douglas St
- 415 Carsin Wayne Ave
- 5703 Salt Rock St
- 619 Harmony Rock Ave
- 5835 Running Horse Dr
- 808 Brown Breeches Ave
- 6084 Silken Saddle St
- 5639 Mesa Sedona St
- 6030 Hidden Summit St
- 5627 Mesa Sedona St
- 329 Gemstone Hill Ave
- 312 Raptors View Ave
- 320 Raptors View Ave
- 5913 Big Horn View St
- 5912 Caddy Ridge St
- 317 Raptors View Ave Unit 1
- 313 Raptors View Ave
- 5917 Big Horn View St
- 321 Raptors View Ave
- 5916 Caddy Ridge St
- 304 Raptors View Ave
- 309 Raptors View Ave
- 5904 Big Horn View St
- 5913 Caddy Ridge St
- 5912 Big Horn View St
- 5921 Big Horn View St
- 325 Raptors View Ave
- 305 Raptors View Ave
- 5920 Caddy Ridge St
- 224 Raptors View Ave Unit 1
- 320 Snow Dome Ave