Estimated Value: $227,880 - $251,000
3
Beds
2
Baths
1,461
Sq Ft
$162/Sq Ft
Est. Value
About This Home
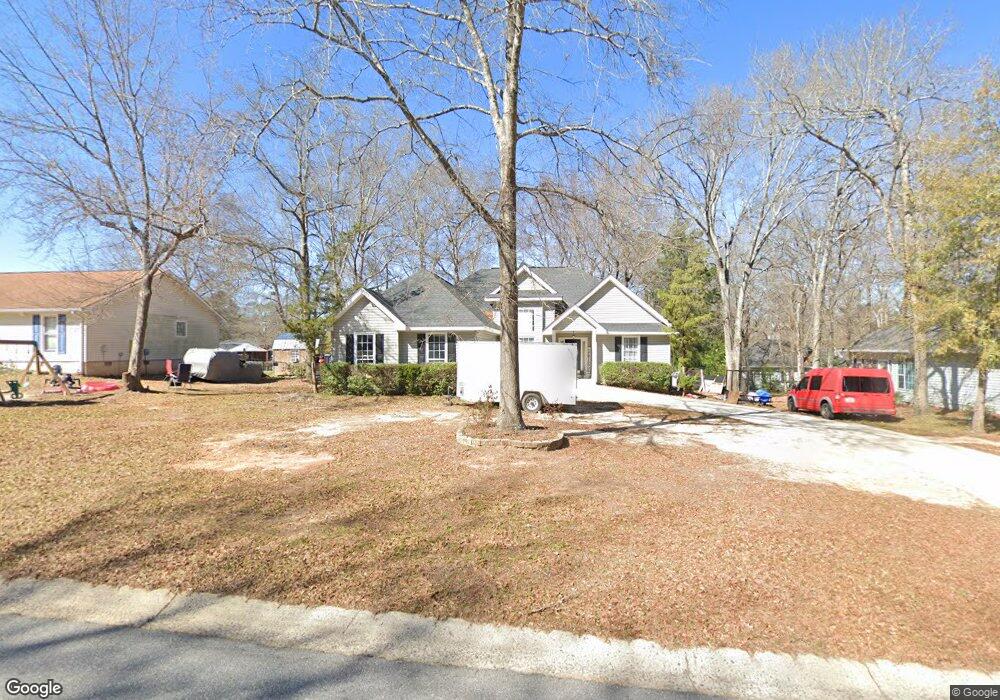
This home is located at 316 Shane Cir, Perry, GA 31069 and is currently estimated at $236,470, approximately $161 per square foot. 316 Shane Cir is a home located in Houston County with nearby schools including Tucker Elementary School, Perry Middle School, and Perry High School.
Ownership History
Date
Name
Owned For
Owner Type
Purchase Details
Closed on
May 15, 2020
Sold by
Portman Celia
Bought by
Starling Kurt Brandon
Current Estimated Value
Home Financials for this Owner
Home Financials are based on the most recent Mortgage that was taken out on this home.
Original Mortgage
$141,391
Outstanding Balance
$123,911
Interest Rate
3.3%
Mortgage Type
FHA
Estimated Equity
$112,559
Purchase Details
Closed on
May 3, 2006
Sold by
Rice Jeannette
Bought by
Rice Willie
Purchase Details
Closed on
Mar 26, 1999
Sold by
Sanders William C and Jane L*
Bought by
Rice Willie and Jeanette E*
Purchase Details
Closed on
Jul 3, 1996
Sold by
Pete Stokes Builders Inc
Bought by
Sanders William C and Jane L*
Purchase Details
Closed on
Dec 29, 1989
Sold by
Stokes W F
Bought by
Pete Stokes Builders Inc
Create a Home Valuation Report for This Property
The Home Valuation Report is an in-depth analysis detailing your home's value as well as a comparison with similar homes in the area
Home Values in the Area
Average Home Value in this Area
Purchase History
| Date | Buyer | Sale Price | Title Company |
|---|---|---|---|
| Starling Kurt Brandon | $144,000 | First American Mortgage Sln | |
| Rice Willie | -- | None Available | |
| Rice Willie | $98,000 | -- | |
| Sanders William C | $94,900 | -- | |
| Pete Stokes Builders Inc | -- | -- |
Source: Public Records
Mortgage History
| Date | Status | Borrower | Loan Amount |
|---|---|---|---|
| Open | Starling Kurt Brandon | $141,391 |
Source: Public Records
Tax History
| Year | Tax Paid | Tax Assessment Tax Assessment Total Assessment is a certain percentage of the fair market value that is determined by local assessors to be the total taxable value of land and additions on the property. | Land | Improvement |
|---|---|---|---|---|
| 2025 | $2,738 | $83,320 | $10,000 | $73,320 |
| 2024 | $2,794 | $76,040 | $10,000 | $66,040 |
| 2023 | $2,362 | $63,840 | $10,000 | $53,840 |
| 2022 | $1,320 | $57,400 | $8,000 | $49,400 |
| 2021 | $1,261 | $54,560 | $8,000 | $46,560 |
| 2020 | $1,018 | $45,840 | $8,000 | $37,840 |
| 2019 | $1,018 | $45,840 | $8,000 | $37,840 |
| 2018 | $1,018 | $45,840 | $8,000 | $37,840 |
| 2017 | $1,020 | $45,840 | $8,000 | $37,840 |
| 2016 | $1,021 | $45,840 | $8,000 | $37,840 |
| 2015 | $1,023 | $45,840 | $8,000 | $37,840 |
| 2014 | -- | $45,840 | $8,000 | $37,840 |
| 2013 | -- | $45,040 | $8,000 | $37,040 |
Source: Public Records
Map
Nearby Homes
- 528 Ansley Ave
- 614 Hillcrest Ave
- 1423 Tucker Rd
- 624 Pine Ridge St
- 625 Cooper St
- 634 Pine Ridge St
- 1207 Tucker Rd
- 1432 Duncan Ave
- 117 Constance Ct
- 903 Massee Ln
- 118 Constance Ct
- 107 Water Run Way
- 214 Farmland Cir
- 203 Farrell Way
- 214 Farmland Cir Unit LOT 8 AG
- 0 Carroll Aly
- 1 Pleasant Oaks Dr
- 202 Farrell Way
- 200 Farrell Way
- 3 Pleasant Oaks Dr
Your Personal Tour Guide
Ask me questions while you tour the home.