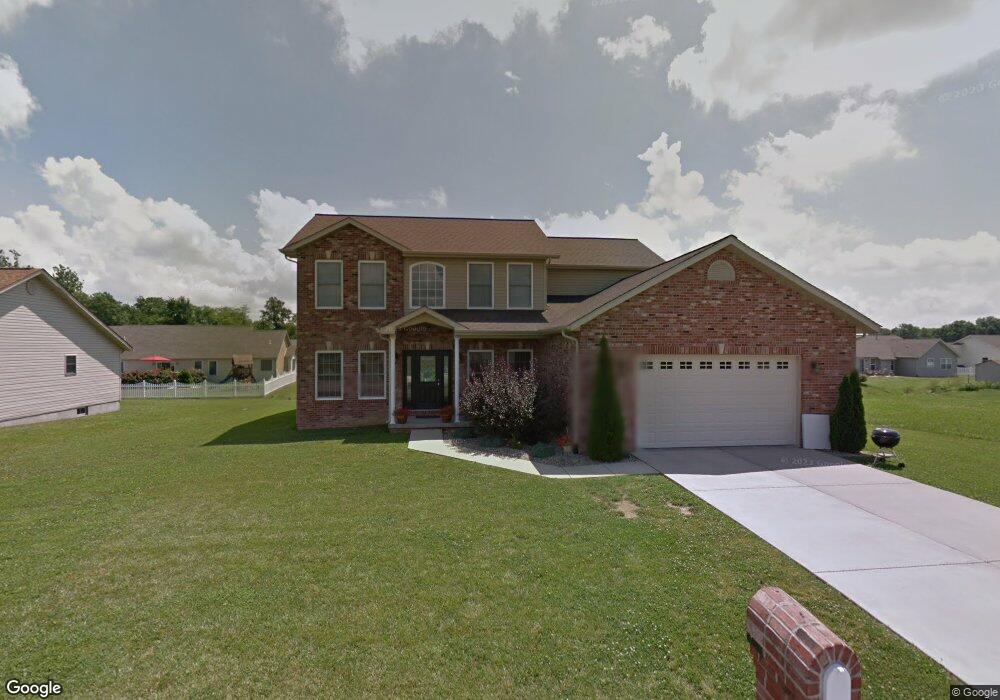
316 Sleeping Indian Dr Freeburg, IL 62243
Estimated Value: $314,000 - $427,000
--
Bed
--
Bath
1,302
Sq Ft
$284/Sq Ft
Est. Value
About This Home
This home is located at 316 Sleeping Indian Dr, Freeburg, IL 62243 and is currently estimated at $369,276, approximately $283 per square foot. 316 Sleeping Indian Dr is a home located in St. Clair County with nearby schools including Freeburg Elementary School, Freeburg Community High School, and St. Joseph Catholic School.
Ownership History
Date
Name
Owned For
Owner Type
Purchase Details
Closed on
Nov 5, 2024
Sold by
Humphries Ronald R and Humphries Heather A
Bought by
Humphries Ronald R
Current Estimated Value
Home Financials for this Owner
Home Financials are based on the most recent Mortgage that was taken out on this home.
Original Mortgage
$287,443
Outstanding Balance
$284,651
Interest Rate
6.25%
Mortgage Type
New Conventional
Estimated Equity
$84,625
Purchase Details
Closed on
May 20, 2015
Sold by
Higgins John P and Higgins Jenna L
Bought by
Humphries Ronald R and Humphries Heather A
Home Financials for this Owner
Home Financials are based on the most recent Mortgage that was taken out on this home.
Original Mortgage
$234,572
Interest Rate
3.5%
Mortgage Type
FHA
Purchase Details
Closed on
Jan 25, 2006
Sold by
Rosa Developers Llc
Bought by
Higgins John P and Higgins Jenna L
Home Financials for this Owner
Home Financials are based on the most recent Mortgage that was taken out on this home.
Original Mortgage
$220,000
Interest Rate
6.37%
Mortgage Type
Construction
Create a Home Valuation Report for This Property
The Home Valuation Report is an in-depth analysis detailing your home's value as well as a comparison with similar homes in the area
Home Values in the Area
Average Home Value in this Area
Purchase History
| Date | Buyer | Sale Price | Title Company |
|---|---|---|---|
| Humphries Ronald R | $82,500 | None Available | |
| Humphries Ronald R | $239,000 | Town & Country Title Co | |
| Higgins John P | $40,000 | None Available |
Source: Public Records
Mortgage History
| Date | Status | Borrower | Loan Amount |
|---|---|---|---|
| Open | Humphries Ronald R | $287,443 | |
| Previous Owner | Humphries Ronald R | $234,572 | |
| Previous Owner | Higgins John P | $220,000 |
Source: Public Records
Tax History Compared to Growth
Tax History
| Year | Tax Paid | Tax Assessment Tax Assessment Total Assessment is a certain percentage of the fair market value that is determined by local assessors to be the total taxable value of land and additions on the property. | Land | Improvement |
|---|---|---|---|---|
| 2024 | $9,004 | $109,044 | $19,771 | $89,273 |
| 2023 | $8,501 | $101,351 | $18,376 | $82,975 |
| 2022 | $7,992 | $93,017 | $16,865 | $76,152 |
| 2021 | $7,695 | $87,586 | $15,880 | $71,706 |
| 2020 | $7,687 | $84,375 | $15,321 | $69,054 |
| 2019 | $7,478 | $84,375 | $15,321 | $69,054 |
| 2018 | $7,220 | $81,419 | $14,784 | $66,635 |
| 2017 | $6,533 | $77,646 | $14,099 | $63,547 |
| 2016 | $6,660 | $78,478 | $14,345 | $64,133 |
| 2014 | $2,864 | $77,227 | $14,116 | $63,111 |
| 2013 | $5,921 | $78,908 | $14,423 | $64,485 |
Source: Public Records
Map
Nearby Homes
- 304 Torrington Ln
- 359 Sleeping Indian Dr
- 363 Sleeping Indian Dr
- 222 Alamosa Dr
- 227 Alamosa Dr
- 420 Foxtail Dr
- 433 Foxtail Dr
- 440 Foxtail Dr
- 302 N Railroad St
- 312 W Phillips St
- 206 N Main St
- 207 N Edison St
- 401 N Edison St
- 520 N Edison St
- 106 S Vine St
- TBB Kraft Rd
- 5433 Kraft Rd
- 3 Park St
- 103 Draco Dr
- 0 Hickory Dr
- 320 Sleeping Indian Dr
- 312 Sleeping Indian Dr
- 317 Glenrock Ln
- 321 Glenrock Ln
- 313 Glenrock Ln
- 317 Sleeping Indian Dr
- 321 Sleeping Indian Dr
- 324 Sleeping Indian Dr
- 308 Sleeping Indian Dr
- 313 Sleeping Indian Dr
- 325 Glenrock Ln
- 309 Glenrock Ln
- 325 Sleeping Indian Dr
- 309 Sleeping Indian Dr
- 316 Torrington Ln
- 304 Sleeping Indian Dr
- 312 Torrington Ln
- 328 Sleeping Indian Dr
- 316 Glenrock Ln
- 305 Glenrock Ln