
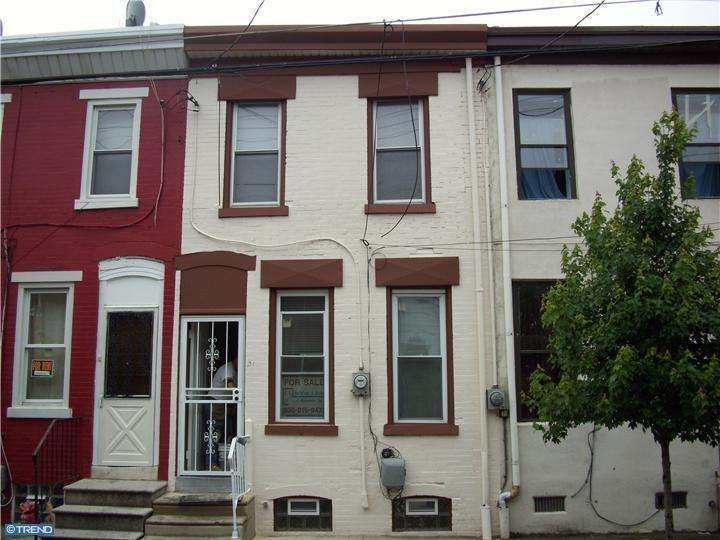
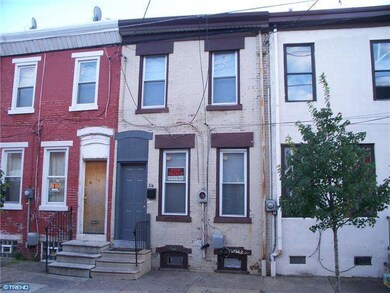
316 Sycamore St Camden, NJ 08103
Bergen Square Neighborhood
2
Beds
1
Bath
780
Sq Ft
858
Sq Ft Lot
Highlights
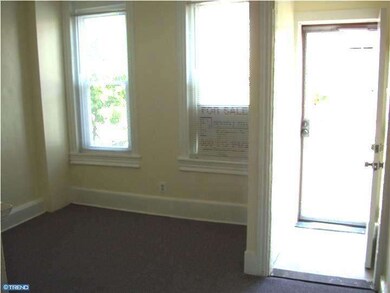
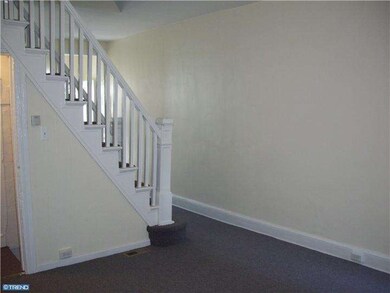
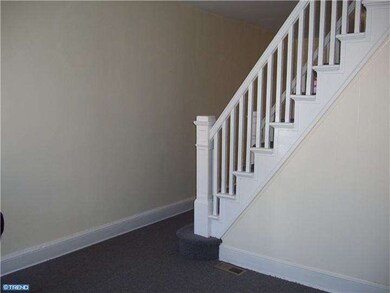
- Living Room
- Dining Room
- 2-minute walk to 3rd & Kaighn Park and Neighborhood Center
- En-Suite Primary Bedroom
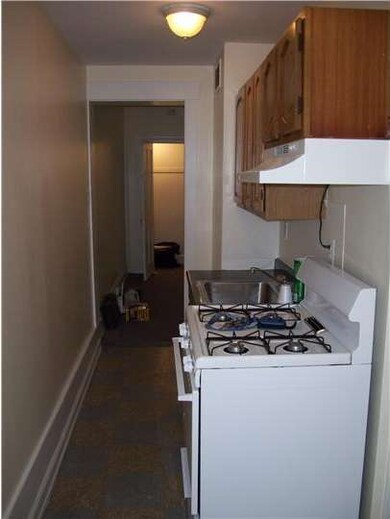
- Heating System Uses Gas
About This Home
As of December 2023PRICE REDUCED!!!!!! Check out this fully renovated 2 bed 1 bath row home in the "Central Waterfront" section of Camden, NJ. Great for the first time home owner. THIS PROPERTY MAY ALSO BE AVAILABLE WITH "OWNER-FINANCING", on an installment-sale basis, for buyers with "problem credit". The qualified applicant will need to show sufficient, stable income, and a stable rental history. This program is for Owner-Occupants- no Investors.
Last Agent to Sell the Property
Dennis J Zisa Associates License #8836971 Listed on: 09/14/2012
Townhouse Details
Home Type
- Townhome
Est. Annual Taxes
- $546
Year Built
- 1899
Lot Details
- 858 Sq Ft Lot
- Lot Dimensions are 13x66
Parking
- On-Street Parking
Home Design
- Brick Exterior Construction
Interior Spaces
- 780 Sq Ft Home
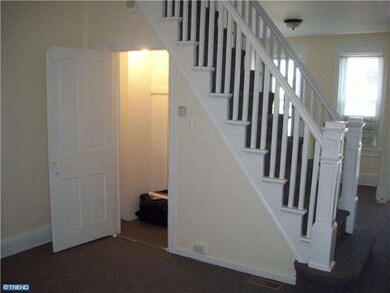
- Property has 2 Levels
- Living Room
- Dining Room
- Basement Fills Entire Space Under The House
Bedrooms and Bathrooms
- 2 Bedrooms
- En-Suite Primary Bedroom
- 1 Full Bathroom
Utilities
- Heating System Uses Gas
- Natural Gas Water Heater
Listing and Financial Details
- Tax Lot 00006
- Assessor Parcel Number 08-00269-00006
Ownership History
Date
Name
Owned For
Owner Type
Purchase Details
Listed on
Jul 26, 2023
Closed on
Dec 20, 2023
Sold by
Ethan E Kra Revocable Living Trust
Bought by
316 Sycamore Llc
Seller's Agent
Jeff Pierson
Dennis J Zisa Associates
Buyer's Agent
Jeff Pierson
Dennis J Zisa Associates
List Price
$75,000
Sold Price
$80,000
Premium/Discount to List
$5,000
6.67%
Views
51
Current Estimated Value
Home Financials for this Owner
Home Financials are based on the most recent Mortgage that was taken out on this home.
Estimated Appreciation
$20,004
Avg. Annual Appreciation
12.92%
Original Mortgage
$77,800
Interest Rate
1.2%
Mortgage Type
New Conventional
Purchase Details
Listed on
Sep 29, 2011
Closed on
Apr 23, 2012
Sold by
Rentz Kenneth L and Rentz Lisa A
Bought by
Kra Ethan and Kra Madelina
Seller's Agent
Dennis Zisa
Dennis J Zisa Associates
Buyer's Agent
Dennis Zisa
Dennis J Zisa Associates
List Price
$29,900
Sold Price
$15,000
Premium/Discount to List
-$14,900
-49.83%
Home Financials for this Owner
Home Financials are based on the most recent Mortgage that was taken out on this home.
Avg. Annual Appreciation
15.41%
Similar Homes in Camden, NJ
Create a Home Valuation Report for This Property
The Home Valuation Report is an in-depth analysis detailing your home's value as well as a comparison with similar homes in the area
Home Values in the Area
Average Home Value in this Area
Purchase History
| Date | Type | Sale Price | Title Company |
|---|---|---|---|
| Bargain Sale Deed | $80,000 | Westcor Land Title | |
| Bargain Sale Deed | $15,000 | None Available |
Source: Public Records
Mortgage History
| Date | Status | Loan Amount | Loan Type |
|---|---|---|---|
| Open | $105,000 | New Conventional | |
| Previous Owner | $77,800 | New Conventional |
Source: Public Records
Property History
| Date | Event | Price | Change | Sq Ft Price |
|---|---|---|---|---|
| 12/27/2023 12/27/23 | Sold | $80,000 | +6.7% | $103 / Sq Ft |
| 10/27/2023 10/27/23 | Pending | -- | -- | -- |
| 10/20/2023 10/20/23 | Price Changed | $75,000 | 0.0% | $96 / Sq Ft |
| 10/20/2023 10/20/23 | For Sale | $75,000 | +10.5% | $96 / Sq Ft |
| 07/28/2023 07/28/23 | Pending | -- | -- | -- |
| 07/26/2023 07/26/23 | For Sale | $67,900 | 0.0% | $87 / Sq Ft |
| 03/03/2018 03/03/18 | Rented | $797 | -3.6% | -- |
| 02/22/2018 02/22/18 | Under Contract | -- | -- | -- |
| 10/09/2017 10/09/17 | For Rent | $827 | 0.0% | -- |
| 07/07/2017 07/07/17 | Rented | $827 | 0.0% | -- |
| 06/19/2017 06/19/17 | Under Contract | -- | -- | -- |
| 05/08/2017 05/08/17 | For Rent | $827 | 0.0% | -- |
| 12/27/2016 12/27/16 | Rented | $827 | 0.0% | -- |
| 12/20/2016 12/20/16 | Under Contract | -- | -- | -- |
| 07/30/2016 07/30/16 | For Rent | $827 | 0.0% | -- |
| 03/09/2015 03/09/15 | Sold | $61,000 | 0.0% | $78 / Sq Ft |
| 02/24/2015 02/24/15 | Pending | -- | -- | -- |
| 11/05/2014 11/05/14 | For Sale | $61,000 | 0.0% | $78 / Sq Ft |
| 11/02/2014 11/02/14 | Off Market | $61,000 | -- | -- |
| 05/09/2014 05/09/14 | For Sale | $61,000 | -0.8% | $78 / Sq Ft |
| 03/04/2013 03/04/13 | Sold | $61,500 | 0.0% | $79 / Sq Ft |
| 03/01/2013 03/01/13 | Pending | -- | -- | -- |
| 09/14/2012 09/14/12 | For Sale | $61,500 | +310.0% | $79 / Sq Ft |
| 04/23/2012 04/23/12 | Sold | $15,000 | -40.0% | $19 / Sq Ft |
| 03/23/2012 03/23/12 | Pending | -- | -- | -- |
| 01/31/2012 01/31/12 | Price Changed | $25,000 | -16.4% | $32 / Sq Ft |
| 09/29/2011 09/29/11 | For Sale | $29,900 | -- | $38 / Sq Ft |
Source: Bright MLS
Tax History Compared to Growth
Tax History
| Year | Tax Paid | Tax Assessment Tax Assessment Total Assessment is a certain percentage of the fair market value that is determined by local assessors to be the total taxable value of land and additions on the property. | Land | Improvement |
|---|---|---|---|---|
| 2025 | $779 | $30,600 | $4,700 | $25,900 |
| 2024 | $754 | $22,000 | $4,700 | $17,300 |
| 2023 | $754 | $22,000 | $4,700 | $17,300 |
| 2022 | $739 | $22,000 | $4,700 | $17,300 |
| 2021 | $737 | $22,000 | $4,700 | $17,300 |
| 2020 | $700 | $22,000 | $4,700 | $17,300 |
| 2019 | $670 | $22,000 | $4,700 | $17,300 |
| 2018 | $666 | $22,000 | $4,700 | $17,300 |
| 2017 | $650 | $22,000 | $4,700 | $17,300 |
| 2016 | $629 | $22,000 | $4,700 | $17,300 |
| 2015 | $606 | $22,000 | $4,700 | $17,300 |
| 2014 | $591 | $22,000 | $4,700 | $17,300 |
Source: Public Records
Agents Affiliated with this Home
-
Jeff Pierson
Seller's Agent in 2023
Jeff Pierson
Dennis J Zisa Associates
(856) 373-0581
3 in this area
45 Total Sales
-
P
Seller's Agent in 2016
PHILIP ZISA
Dennis J Zisa Associates
-
Dennis Zisa
Seller's Agent in 2013
Dennis Zisa
Dennis J Zisa Associates
(856) 541-2228
8 Total Sales
Map
Source: Bright MLS
MLS Number: 1004097478
APN: 08-00269-0000-00006
Disclaimer: Certain information contained herein is derived from information provided by parties other than Homes.com. All information provided is deemed reliable, but is not guaranteed to be accurate and should be independently verified.
![]() The data relating to real estate for sale on this website appears in part through the BRIGHT Internet Data Exchange program, a voluntary cooperative exchange of property listing data between licensed real estate brokerage firms, and is provided by BRIGHT through a licensing agreement.
The data relating to real estate for sale on this website appears in part through the BRIGHT Internet Data Exchange program, a voluntary cooperative exchange of property listing data between licensed real estate brokerage firms, and is provided by BRIGHT through a licensing agreement.
Listing information is from various brokers who participate in the Bright MLS IDX program and not all listings may be visible on the site.
The property information being provided on or through the website is for the personal, non-commercial use of consumers and such information may not be used for any purpose other than to identify prospective properties consumers may be interested in purchasing.
Some properties which appear for sale on the website may no longer be available because they are for instance, under contract, sold or are no longer being offered for sale.
Property information displayed is deemed reliable but is not guaranteed.
Copyright 2025 Bright MLS, Inc.
Nearby Homes
- 307 Sycamore St
- 323 1/2 Kaighns Ave
- 340 Chestnut St
- 313 Chestnut St
- 309 Mount Vernon St
- 1042 S 4th St
- 317 Walnut St
- 452 Mechanic St
- 1451 S 4th St
- 825 Dauphin St
- 608 Sycamore St
- 712 S 3rd St
- 312 Line St
- 634 Walnut St
- 780-788 Sycamore St
- 809 S 6th St
- 602 S 5th St
- 810 S 6th St
- 611 Saint John St
- 751 Chestnut St