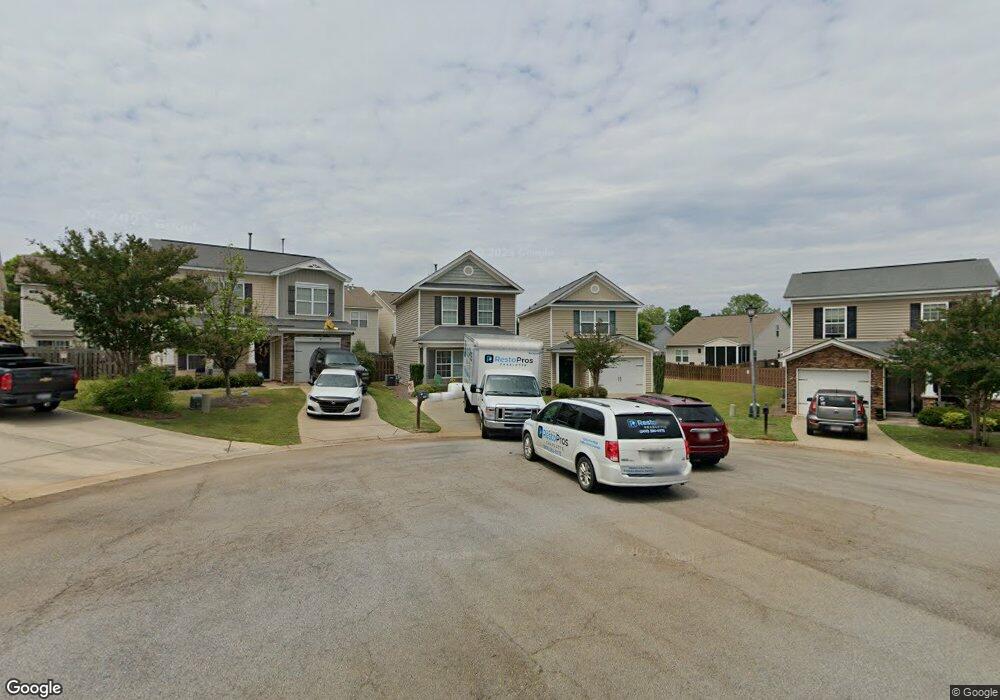
316 Tyler Hill Ct Unit 89 Columbia, SC 29212
Estimated Value: $206,000 - $220,000
2
Beds
3
Baths
1,218
Sq Ft
$176/Sq Ft
Est. Value
About This Home
This home is located at 316 Tyler Hill Ct Unit 89, Columbia, SC 29212 and is currently estimated at $214,523, approximately $176 per square foot. 316 Tyler Hill Ct Unit 89 is a home located in Lexington County with nearby schools including Irmo Elementary School, Irmo Middle, and Irmo High.
Ownership History
Date
Name
Owned For
Owner Type
Purchase Details
Closed on
Dec 13, 2013
Sold by
Carter Duane V
Bought by
Gibson John L
Current Estimated Value
Home Financials for this Owner
Home Financials are based on the most recent Mortgage that was taken out on this home.
Original Mortgage
$112,875
Outstanding Balance
$84,099
Interest Rate
4.13%
Mortgage Type
VA
Estimated Equity
$130,424
Purchase Details
Closed on
Nov 5, 2010
Sold by
Murray Builders Llc
Bought by
Carter Duane
Home Financials for this Owner
Home Financials are based on the most recent Mortgage that was taken out on this home.
Original Mortgage
$91,453
Interest Rate
4.38%
Mortgage Type
Future Advance Clause Open End Mortgage
Purchase Details
Closed on
Aug 11, 2010
Sold by
Murray Landings Townhomes Llc
Bought by
Murray Builders Llc
Home Financials for this Owner
Home Financials are based on the most recent Mortgage that was taken out on this home.
Original Mortgage
$92,000
Interest Rate
4.61%
Mortgage Type
New Conventional
Create a Home Valuation Report for This Property
The Home Valuation Report is an in-depth analysis detailing your home's value as well as a comparison with similar homes in the area
Home Values in the Area
Average Home Value in this Area
Purchase History
| Date | Buyer | Sale Price | Title Company |
|---|---|---|---|
| Gibson John L | $110,500 | -- | |
| Carter Duane | $114,317 | -- | |
| Murray Builders Llc | $25,000 | -- |
Source: Public Records
Mortgage History
| Date | Status | Borrower | Loan Amount |
|---|---|---|---|
| Open | Gibson John L | $112,875 | |
| Previous Owner | Carter Duane | $91,453 | |
| Previous Owner | Murray Builders Llc | $92,000 |
Source: Public Records
Tax History Compared to Growth
Tax History
| Year | Tax Paid | Tax Assessment Tax Assessment Total Assessment is a certain percentage of the fair market value that is determined by local assessors to be the total taxable value of land and additions on the property. | Land | Improvement |
|---|---|---|---|---|
| 2024 | $748 | $4,892 | $1,200 | $3,692 |
| 2023 | $748 | $4,892 | $1,200 | $3,692 |
| 2020 | $790 | $4,892 | $1,200 | $3,692 |
| 2019 | $732 | $4,451 | $1,200 | $3,251 |
| 2018 | $644 | $4,451 | $1,200 | $3,251 |
| 2017 | $628 | $4,451 | $1,200 | $3,251 |
| 2016 | $643 | $4,451 | $1,200 | $3,251 |
| 2014 | $637 | $4,420 | $1,200 | $3,220 |
| 2013 | -- | $6,860 | $1,800 | $5,060 |
Source: Public Records
Map
Nearby Homes
- 106 Regency Place
- 139 Shoals Landing Dr
- 363 Silver Anchor Dr
- 308 Sawyer Ct
- 725 Green Branch Ct
- 104 Keats Ct
- 1002 Leamington Cir
- 746 Bent Creek Dr
- 217 Browning Ln
- 806 Village Ln
- 508 Tennyson Dr
- 6 Sagefire Ct
- 180 Palm Point Dr
- 133 Wells Garden Ct
- 103 Cressfell Cir
- 124 Torbay Rd
- 425 Silver Anchor Dr
- 116 Trent House Rd
- 1309 Farming Creek Rd
- 155 Doverside Dr
- 316 Tyler Hill Ct
- 320 Tyler Hill Ct
- 320 Tyler Hill Ct Unit LOT 90
- 312 Tyler Hill Ct
- 312 Tyler Hill Ct Unit LOT 88
- 256 Merchants Dr
- 254 Merchants Dr
- 164 Regency Dr
- 252 Merchants Dr
- 252 Merchants Dr Unit 22
- 168 Regency Dr
- 321 Tyler Hill Ct
- 250 Merchants Dr
- 160 Regency Dr
- 160 Regency Dr Unit Lot 77
- 308 Tyler Hill Ct
- 172 Regency Dr
- 248 Merchants Dr
- 260 Merchants Dr
- 246 Merchants Dr