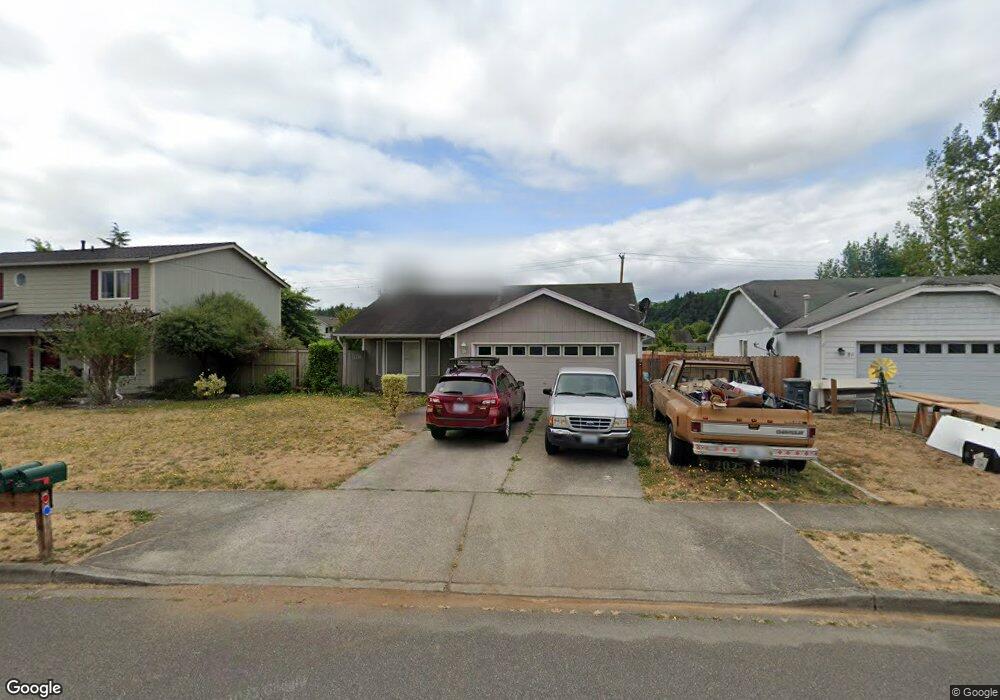
316 Williams Blvd NW Orting, WA 98360
Estimated Value: $443,000 - $475,000
3
Beds
2
Baths
1,092
Sq Ft
$427/Sq Ft
Est. Value
About This Home
This home is located at 316 Williams Blvd NW, Orting, WA 98360 and is currently estimated at $465,758, approximately $426 per square foot. 316 Williams Blvd NW is a home located in Pierce County with nearby schools including Orting Elementary School, Ptarmigan Ridge Elementary School, and Orting Middle School.
Ownership History
Date
Name
Owned For
Owner Type
Purchase Details
Closed on
Oct 22, 2005
Sold by
Smith Matthew J
Bought by
Silver Steven E and Silver Debra E
Current Estimated Value
Home Financials for this Owner
Home Financials are based on the most recent Mortgage that was taken out on this home.
Original Mortgage
$88,950
Outstanding Balance
$47,340
Interest Rate
5.67%
Mortgage Type
Fannie Mae Freddie Mac
Estimated Equity
$418,418
Purchase Details
Closed on
Sep 21, 1999
Sold by
Keaton Larry J
Bought by
Smith Matthew J
Home Financials for this Owner
Home Financials are based on the most recent Mortgage that was taken out on this home.
Original Mortgage
$132,362
Interest Rate
8.09%
Mortgage Type
FHA
Purchase Details
Closed on
Aug 26, 1996
Sold by
Village Green Ltd Partnership
Bought by
Keaton Larry J and Keaton Jamie L
Home Financials for this Owner
Home Financials are based on the most recent Mortgage that was taken out on this home.
Original Mortgage
$96,650
Interest Rate
8.23%
Create a Home Valuation Report for This Property
The Home Valuation Report is an in-depth analysis detailing your home's value as well as a comparison with similar homes in the area
Home Values in the Area
Average Home Value in this Area
Purchase History
| Date | Buyer | Sale Price | Title Company |
|---|---|---|---|
| Silver Steven E | $171,867 | Fidelity National Title Insu | |
| Smith Matthew J | $133,500 | First American Title Ins Co | |
| Keaton Larry J | $99,675 | First American Title Ins Co |
Source: Public Records
Mortgage History
| Date | Status | Borrower | Loan Amount |
|---|---|---|---|
| Open | Silver Steven E | $88,950 | |
| Previous Owner | Smith Matthew J | $132,362 | |
| Previous Owner | Keaton Larry J | $96,650 |
Source: Public Records
Tax History Compared to Growth
Tax History
| Year | Tax Paid | Tax Assessment Tax Assessment Total Assessment is a certain percentage of the fair market value that is determined by local assessors to be the total taxable value of land and additions on the property. | Land | Improvement |
|---|---|---|---|---|
| 2025 | $3,370 | $391,300 | $199,000 | $192,300 |
| 2024 | $3,370 | $387,900 | $199,000 | $188,900 |
| 2023 | $3,370 | $364,800 | $191,000 | $173,800 |
| 2022 | $3,130 | $378,100 | $191,000 | $187,100 |
| 2021 | $3,199 | $264,100 | $114,400 | $149,700 |
| 2019 | $2,839 | $236,400 | $97,100 | $139,300 |
| 2018 | $2,914 | $220,200 | $84,600 | $135,600 |
| 2017 | $2,666 | $193,200 | $67,900 | $125,300 |
| 2016 | $2,452 | $157,600 | $52,800 | $104,800 |
| 2014 | $2,028 | $146,300 | $47,200 | $99,100 |
| 2013 | $2,028 | $120,800 | $37,100 | $83,700 |
Source: Public Records
Map
Nearby Homes
- 1205 Boatman Ave NW
- 1113 Ofarrell Ln NW
- 1208 Sigafoos Ave NW
- 1309 Riddell Ave NE
- 1108 Sigafoos Ave NW
- 1105 Sigafoos Ave NW
- 1114 Ross Ave NW
- 1005 van Ogle Ln NW
- 15405 148th Avenue Ct E
- 1415 Riddell Ave NE
- 1002 O'Farrell Ln NW
- 15301 147th Ave E
- 1503 Riddell Ave NE
- 912 O'Farrell Ln NW
- 116 Mazza St NE
- 1605 Riddell Ave NE
- 1602 Riddell Ave NE
- 1324 Hansberry Ave NE
- 114 Ames St NE
- 812 Sigafoos Ave NW
- 318 Williams Blvd NW
- 314 Williams Blvd NW
- 1311 Nunnally Ave NW
- 320 Williams Blvd NW
- 315 Williams Blvd NW
- 1309 Nunnally Ave NW
- 322 Williams Blvd NW
- 1316 Headley Ave NW
- 1318 Headley Ave NW
- 317 Williams Blvd NW
- 1314 Headley Ave NW
- 313 Williams Blvd NW
- 1320 Headley Ave NW
- 319 Williams Blvd NW
- 1312 Headley Ave NW
- 1307 Nunnally Ave NW
- 324 Williams Blvd NW
- 1402 Headley Ave NW
- 311 Williams Blvd NW
- 312 Williams Blvd NW