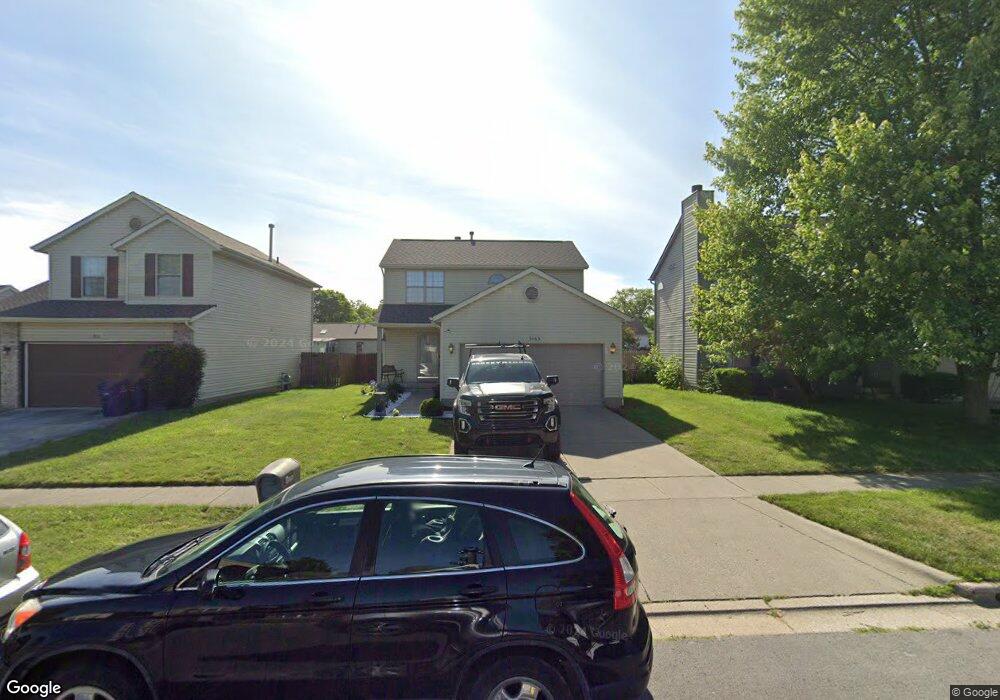
3163 Retriever Rd Unit 97 Columbus, OH 43232
Walnut Heights NeighborhoodEstimated Value: $273,000 - $283,000
3
Beds
3
Baths
1,440
Sq Ft
$193/Sq Ft
Est. Value
About This Home
This home is located at 3163 Retriever Rd Unit 97, Columbus, OH 43232 and is currently estimated at $278,149, approximately $193 per square foot. 3163 Retriever Rd Unit 97 is a home located in Franklin County with nearby schools including Liberty Elementary School, Yorktown Middle School, and Independence High School.
Ownership History
Date
Name
Owned For
Owner Type
Purchase Details
Closed on
Nov 2, 2020
Sold by
Jennings Sandra C
Bought by
Perez Joan A Calcano
Current Estimated Value
Home Financials for this Owner
Home Financials are based on the most recent Mortgage that was taken out on this home.
Original Mortgage
$171,652
Outstanding Balance
$152,746
Interest Rate
2.8%
Mortgage Type
FHA
Estimated Equity
$125,403
Purchase Details
Closed on
Mar 15, 2000
Sold by
Crossmann Communities Of Ohio Inc
Bought by
Jennings Sandra C
Home Financials for this Owner
Home Financials are based on the most recent Mortgage that was taken out on this home.
Original Mortgage
$107,292
Interest Rate
8.39%
Mortgage Type
Purchase Money Mortgage
Create a Home Valuation Report for This Property
The Home Valuation Report is an in-depth analysis detailing your home's value as well as a comparison with similar homes in the area
Home Values in the Area
Average Home Value in this Area
Purchase History
| Date | Buyer | Sale Price | Title Company |
|---|---|---|---|
| Perez Joan A Calcano | $180,000 | Access Title Agency | |
| Jennings Sandra C | $119,300 | Chicago Title West |
Source: Public Records
Mortgage History
| Date | Status | Borrower | Loan Amount |
|---|---|---|---|
| Open | Perez Joan A Calcano | $171,652 | |
| Previous Owner | Jennings Sandra C | $107,292 |
Source: Public Records
Tax History Compared to Growth
Tax History
| Year | Tax Paid | Tax Assessment Tax Assessment Total Assessment is a certain percentage of the fair market value that is determined by local assessors to be the total taxable value of land and additions on the property. | Land | Improvement |
|---|---|---|---|---|
| 2024 | $3,681 | $82,010 | $23,280 | $58,730 |
| 2023 | $3,634 | $82,005 | $23,275 | $58,730 |
| 2022 | $2,565 | $49,460 | $5,250 | $44,210 |
| 2021 | $2,570 | $49,460 | $5,250 | $44,210 |
| 2020 | $2,573 | $49,460 | $5,250 | $44,210 |
| 2019 | $2,506 | $41,310 | $4,380 | $36,930 |
| 2018 | $2,394 | $41,310 | $4,380 | $36,930 |
| 2017 | $2,504 | $41,310 | $4,380 | $36,930 |
| 2016 | $2,521 | $38,050 | $4,240 | $33,810 |
| 2015 | $2,288 | $38,050 | $4,240 | $33,810 |
| 2014 | $2,241 | $37,180 | $4,240 | $32,940 |
| 2013 | $1,300 | $43,715 | $4,970 | $38,745 |
Source: Public Records
Map
Nearby Homes
- 3387 Retriever Rd
- 5401 Spire Ln
- 5373 Spire Ln
- 3000 Whitlow Rd
- 2998 Osgood Rd E
- 5397 Jack Russell Way
- 3289 Kady Ln
- 3246 Latonia Rd
- 5377 Bleaker Ave
- 3148 Aldgate St
- 5125 Upton Rd N
- 3198 Gallant Dr
- 2901 Renfro Rd
- 5152 Burdett Dr
- 5882 Abernathy Ln Unit 5882F
- 4974 Silverton Dr
- 5278 Glenbriar Ct
- 5137 Holbrook Dr
- St Martin Plan at Chatterton Commons
- 3310 Joshstock Dr
- 3163 Retriever Rd
- 3155 Retriever Rd
- 3171 Retriever Rd
- 3179 Retriever Rd
- 3179 Retriever Rd Unit L95
- 3147 Retriever Rd
- 3147 Retriever Rd Unit L 69
- 3174 St Bernard Cir
- 3174 Saint Bernard Cir
- 3166 St Bernard Cir
- 3166 Saint Bernard Cir
- 3182 Saint Bernard Cir
- 3187 Retriever Rd
- 3190 Saint Bernard Cir
- 3158 Saint Bernard Cir
- 3164 Retriever Rd
- 3172 Retriever Rd
- 3156 Retriever Rd
- 3198 Saint Bernard Cir
- 3198 St Bernard Cir