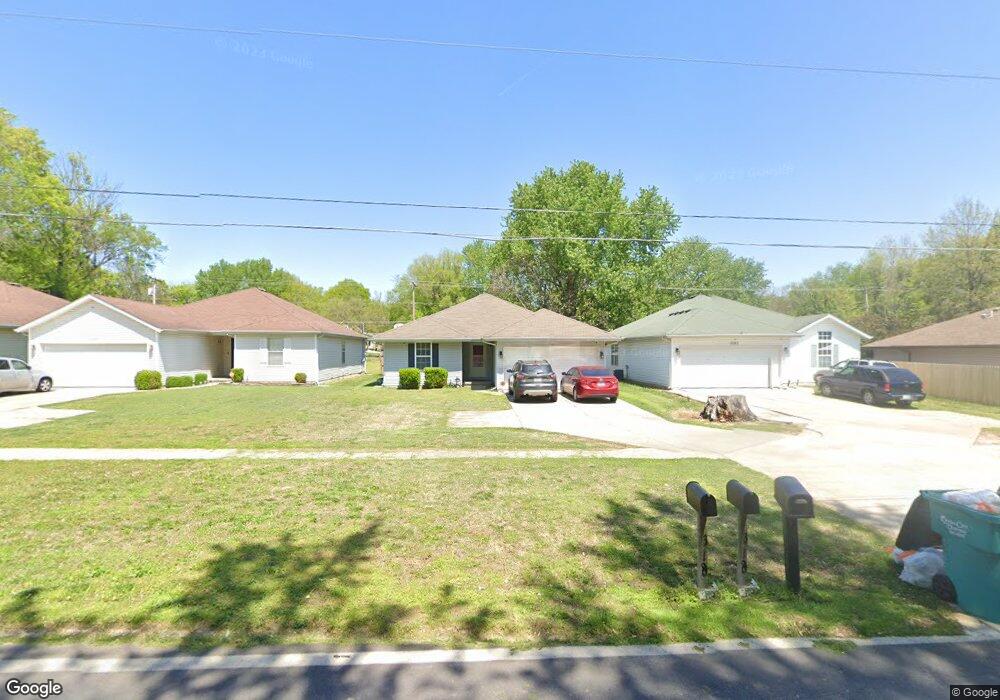
3163 W Grand St Springfield, MO 65802
Westside NeighborhoodEstimated Value: $193,000 - $212,000
3
Beds
2
Baths
1,368
Sq Ft
$148/Sq Ft
Est. Value
About This Home
This home is located at 3163 W Grand St, Springfield, MO 65802 and is currently estimated at $202,437, approximately $147 per square foot. 3163 W Grand St is a home located in Greene County with nearby schools including Westport K-8 School and Central High School.
Ownership History
Date
Name
Owned For
Owner Type
Purchase Details
Closed on
Jul 15, 2011
Sold by
Federal National Mortgage Association
Bought by
England Christopher A
Current Estimated Value
Home Financials for this Owner
Home Financials are based on the most recent Mortgage that was taken out on this home.
Original Mortgage
$2,295
Outstanding Balance
$1,580
Interest Rate
4.52%
Mortgage Type
Stand Alone Second
Estimated Equity
$200,857
Purchase Details
Closed on
Feb 8, 2011
Sold by
Hicks Jerod
Bought by
Federal National Mortgage Association
Purchase Details
Closed on
Oct 19, 2007
Sold by
Follett Andrew D and Follett Stephanie
Bought by
Hicks Jerod
Home Financials for this Owner
Home Financials are based on the most recent Mortgage that was taken out on this home.
Original Mortgage
$108,500
Interest Rate
6.37%
Mortgage Type
New Conventional
Purchase Details
Closed on
May 5, 2006
Sold by
Tindall Walker Construction and Tindall Bruce D
Bought by
Follett Andrew D
Home Financials for this Owner
Home Financials are based on the most recent Mortgage that was taken out on this home.
Original Mortgage
$98,900
Interest Rate
6.32%
Mortgage Type
New Conventional
Create a Home Valuation Report for This Property
The Home Valuation Report is an in-depth analysis detailing your home's value as well as a comparison with similar homes in the area
Home Values in the Area
Average Home Value in this Area
Purchase History
| Date | Buyer | Sale Price | Title Company |
|---|---|---|---|
| England Christopher A | -- | None Available | |
| Federal National Mortgage Association | $102,943 | None Available | |
| Hicks Jerod | -- | None Available | |
| Follett Andrew D | -- | None Available |
Source: Public Records
Mortgage History
| Date | Status | Borrower | Loan Amount |
|---|---|---|---|
| Open | England Christopher A | $2,295 | |
| Previous Owner | Hicks Jerod | $108,500 | |
| Previous Owner | Follett Andrew D | $98,900 |
Source: Public Records
Tax History Compared to Growth
Tax History
| Year | Tax Paid | Tax Assessment Tax Assessment Total Assessment is a certain percentage of the fair market value that is determined by local assessors to be the total taxable value of land and additions on the property. | Land | Improvement |
|---|---|---|---|---|
| 2025 | $1,130 | $24,640 | $3,800 | $20,840 |
| 2024 | $1,130 | $21,070 | $2,280 | $18,790 |
| 2023 | $1,124 | $21,070 | $2,280 | $18,790 |
| 2022 | $1,007 | $18,430 | $2,280 | $16,150 |
| 2021 | $1,006 | $18,430 | $2,280 | $16,150 |
| 2020 | $1,026 | $17,960 | $2,280 | $15,680 |
| 2019 | $997 | $17,960 | $2,280 | $15,680 |
| 2018 | $931 | $16,780 | $1,900 | $14,880 |
| 2017 | $921 | $17,560 | $1,900 | $15,660 |
| 2016 | $962 | $17,560 | $1,900 | $15,660 |
| 2015 | $954 | $17,560 | $1,900 | $15,660 |
| 2014 | $961 | $17,560 | $1,900 | $15,660 |
Source: Public Records
Map
Nearby Homes
- 3245 W Lombard St
- 3242 W Page St
- 3457 W Lombard St
- 2901 W Grand St
- 3156 W Mount Vernon St
- 915 S Oak Park Ave
- 1325 S Brite Ave
- 512 S Laurel Ave
- 3001 W Mount Vernon St
- 2932 W Mount Vernon St
- 3656 W Kay Pointe Blvd
- 3015 W Lincoln St
- 2950 W Lincoln St
- 2946 W Elm St
- 3211 W Walnut St
- 2731 W State St
- 2723 W State St
- 2539 W Lombard St
- 2831 W Elm St
- 222 N Westport Ave
- 3161 W Grand St
- 3203 W Grand St
- 3153 W Grand St
- 3166 W Grand St
- 3205 W Grand St
- 3149 W Grand St
- 3145 W Grand St
- 3144 Grand St
- 3144 W Grand St
- 3217 W Grand St
- 3141 W Grand St
- 3164 W Lombard St
- 3156 W Lombard St
- 1027 S Overhill Ave
- 3214 W Lombard St
- 3226 W Grand St
- 3137 W Grand St
- 3152 W Lombard St
- 3112 W Grand St
- 1026 S Overhill Ave