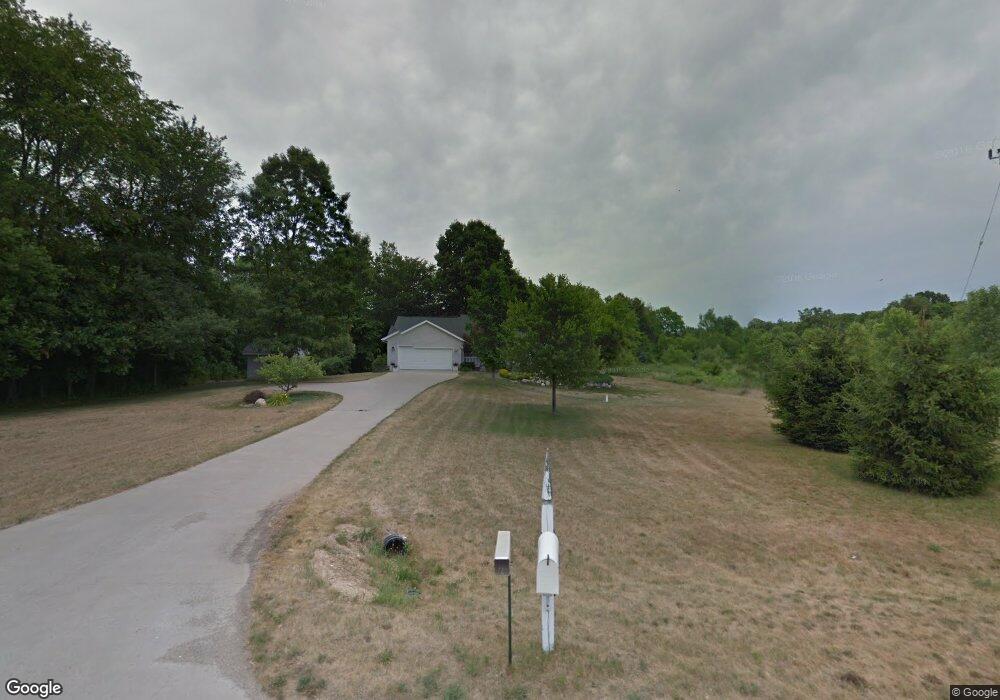
31639 Hidden Pines Dr Paw Paw, MI 49079
Estimated Value: $316,000 - $366,452
--
Bed
--
Bath
1,616
Sq Ft
$209/Sq Ft
Est. Value
About This Home
This home is located at 31639 Hidden Pines Dr, Paw Paw, MI 49079 and is currently estimated at $337,363, approximately $208 per square foot. 31639 Hidden Pines Dr is a home located in Van Buren County with nearby schools including Paw Paw Early Elementary School, Paw Paw Later Elementary School, and Paw Paw Middle School.
Ownership History
Date
Name
Owned For
Owner Type
Purchase Details
Closed on
Jun 30, 2000
Sold by
Cekala John S and Cekala Roxann
Bought by
Henning Barbara
Current Estimated Value
Purchase Details
Closed on
Oct 11, 1999
Sold by
Czekala John S and Czekala Roxann
Bought by
B & H Investments
Purchase Details
Closed on
Apr 6, 1999
Bought by
Czekala John S and Czekala John L
Create a Home Valuation Report for This Property
The Home Valuation Report is an in-depth analysis detailing your home's value as well as a comparison with similar homes in the area
Home Values in the Area
Average Home Value in this Area
Purchase History
| Date | Buyer | Sale Price | Title Company |
|---|---|---|---|
| Henning Barbara | $155,000 | -- | |
| B & H Investments | $24,400 | -- | |
| Czekala John S | -- | -- |
Source: Public Records
Tax History Compared to Growth
Tax History
| Year | Tax Paid | Tax Assessment Tax Assessment Total Assessment is a certain percentage of the fair market value that is determined by local assessors to be the total taxable value of land and additions on the property. | Land | Improvement |
|---|---|---|---|---|
| 2025 | $1,208 | $198,800 | $0 | $0 |
| 2024 | $1,208 | $174,200 | $0 | $0 |
| 2023 | $1,150 | $160,800 | $0 | $0 |
| 2022 | $3,595 | $144,300 | $0 | $0 |
| 2021 | $3,368 | $115,000 | $18,500 | $96,500 |
| 2020 | $3,198 | $115,000 | $18,500 | $96,500 |
| 2019 | $3,049 | $110,300 | $110,300 | $0 |
| 2018 | $2,978 | $104,200 | $104,200 | $0 |
| 2017 | $2,919 | $96,500 | $0 | $0 |
| 2016 | $2,901 | $94,400 | $0 | $0 |
| 2015 | $2,600 | $94,400 | $0 | $0 |
| 2014 | $2,584 | $86,700 | $0 | $0 |
| 2013 | -- | $85,300 | $85,300 | $0 |
Source: Public Records
Map
Nearby Homes
- 31639 Hidden Pines Dr
- 31278 Hidden Pines Dr
- 31278 Hidden Pines Dr
- 30945 Hidden Pines
- 31878 M 43
- 30945 Hidden Pines Dr
- 30153 Hidden Pines Dr
- 30166 Hidden Pines Dr
- 2 Hidden Pines Dr
- 7 Hidden Pines Dr
- 31955 Hidden Pines Dr
- 0 Hidden Pines Dr
- 31080 Hidden Pines
- 30765 Hidden Pines Dr
- 31080 Hidden Pines Dr
- 31896 Michigan 43
- 31368 M 43
- 31368 Michigan 43
- 31896 M 43
- 32080 M 43